
An interactive NVIDIA-GPU process viewer and beyond, the one-stop solution for GPU process management.
nvitop







An interactive NVIDIA-GPU process viewer and beyond, the one-stop solution for GPU process management. The full API references host at
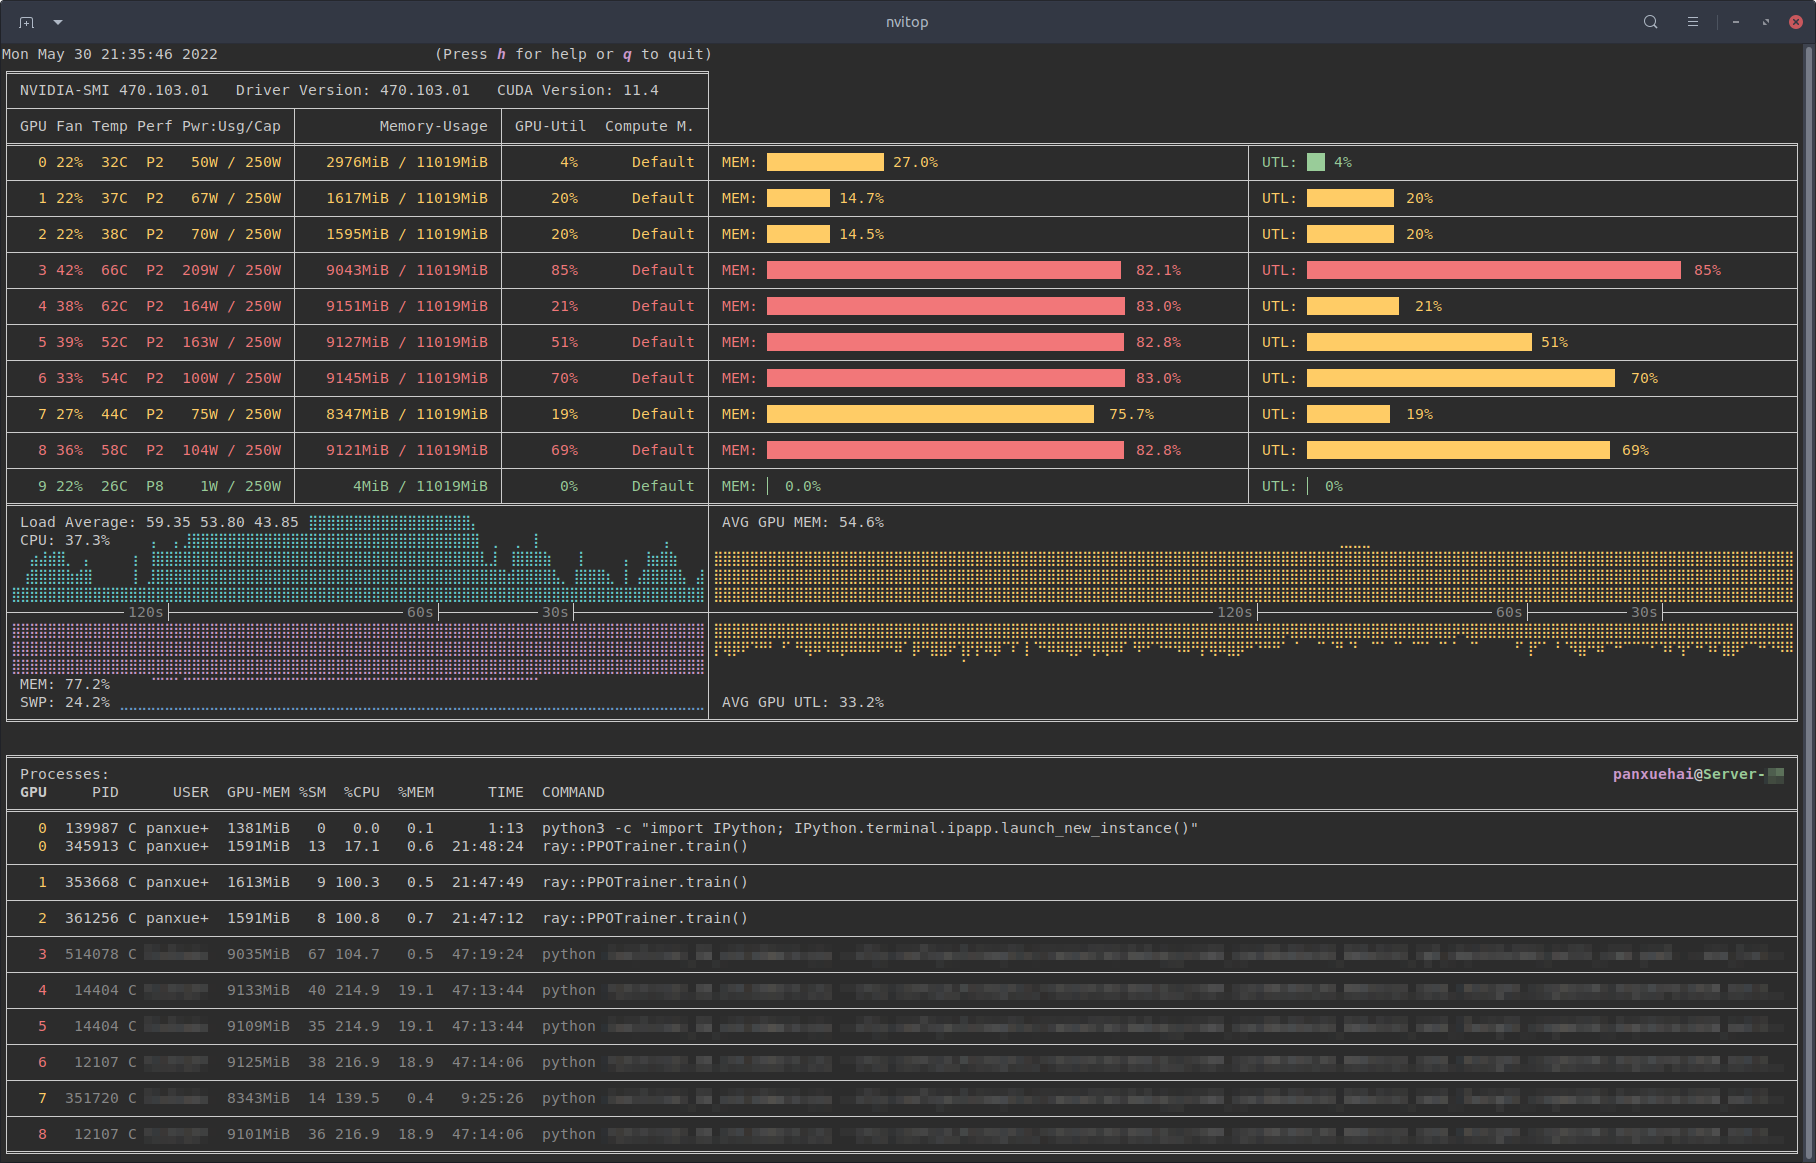
Monitor mode of nvitop.
(TERM: GNOME Terminal / OS: Ubuntu 16.04 LTS (over SSH) / Locale: en_US.UTF-8)
A Grafana dashboard built on top of nvitop-exporter.
Table of Contents
- Device and Process Status - Resource Monitor - For Docker Users - For SSH Users - Command Line Options and Environment Variables - Keybindings for Monitor Mode - CUDA Visible Devices Selection Tool - More than a Monitor - Quick Start - Status Snapshot - Resource Metric Collector - Low-level APIs - Device - Process - Host (inherited from psutil) - Copyright Noticenvitop is an interactive NVIDIA device and process monitoring tool. It has a colorful and informative interface that continuously updates the status of the devices and processes. As a resource monitor, it includes many features and options, such as tree-view, environment variable viewing, process filtering, process metrics monitoring, etc. Beyond that, the package also ships a CUDA device selection tool nvisel for deep learning researchers. It also provides handy APIs that allow developers to write their own monitoring tools. Please refer to section More than a Monitor and the full API references at

Process filtering and a more colorful interface.

Compare to nvidia-smi.
Features
- Informative and fancy output: show more information than
nvidia-smiwith colorized fancy box drawing. - Monitor mode: can run as a resource monitor, rather than print the results only once.
- Interactive: responsive for user input (from keyboard and/or mouse) in monitor mode. (vs. gpustat & py3nvml)
- Efficient:
nvidia-smi. (vs. nvidia-htop)
- support sparse query and cache results with TTLCache from cachetools. (vs. gpustat)
- display information using the curses library rather than print with ANSI escape codes. (vs. py3nvml)
- asynchronously gather information using multi-threading and correspond to user input much faster. (vs. nvtop)
- Portable: work on both Linux and Windows.
ps -p <pid> in a subprocess. (vs. nvidia-htop & py3nvml)
- written in pure Python, easy to install with pip. (vs. nvtop)
- Integrable: easy to integrate into other applications, more than monitoring. (vs. nvidia-htop & nvtop)

nvitop supports Windows!
(SHELL: PowerShell / TERM: Windows Terminal / OS: Windows 10 / Locale: en-US)
Requirements
- Python 3.8+
- NVIDIA Management Library (NVML)
- nvidia-ml-py
- psutil
- curses* (with
libncursesw)
This repository contains a Bash script to install/upgrade the NVIDIA drivers for Ubuntu Linux. For example:
git clone --depth=1 https://github.com/XuehaiPan/nvitop.git && cd nvitop
Change to tty3 console (required for desktop users with GUI (tty2))
Optional for SSH users
sudo chvt 3  # or use keyboard shortcut: Ctrl-LeftAlt-F3
bash install-nvidia-driver.sh --package=nvidia-driver-595  # install the R595 driver from ppa:graphics-drivers bash install-nvidia-driver.sh --latest                     # install the latest driver from ppa:graphics-drivers bash install-nvidia-driver.sh --latest --open              # install the latest open-kernel-module driver

NVIDIA driver installer for Ubuntu Linux.
Run bash install-nvidia-driver.sh --help for more information.
* The curses library is a built-in module of Python on Unix-like systems, and it is supported by a third-party package called windows-curses on Windows using PDCurses. Inconsistent behavior of nvitop may occur on different terminal emulators on Windows, such as missing mouse support.
Installation
It is highly recommended to install nvitop in an isolated virtual environment. Simple installation and run via uvx (a.k.a. uv tool run) or pipx:
uvx nvitop
or
pipx run nvitop
You can also set this command as an alias in your shell startup file, e.g.:
# For Bash
echo 'alias nvitop="uvx nvitop"' >> ~/.bashrc
For Zsh
echo 'alias nvitop="uvx nvitop"' >> ~/.zshrc
For Fish
mkdir -p ~/.config/fish
echo 'alias nvitop="uvx nvitop"' >> ~/.config/fish/config.fish
For PowerShell
New-Item -Path (Split-Path -Parent -Path $PROFILE.CurrentUserAllHosts) -ItemType Directory -Force
'Function nvitop { uvx nvitop @Args }' >> $PROFILE.CurrentUserAllHosts
or
# For Bash
echo 'alias nvitop="pipx run nvitop"' >> ~/.bashrc
For Zsh
echo 'alias nvitop="pipx run nvitop"' >> ~/.zshrc
For Fish
mkdir -p ~/.config/fish
echo 'alias nvitop="pipx run nvitop"' >> ~/.config/fish/config.fish
For PowerShell
New-Item -Path (Split-Path -Parent -Path $PROFILE.CurrentUserAllHosts) -ItemType Directory -Force
'Function nvitop { pipx run nvitop @Args }' >> $PROFILE.CurrentUserAllHosts
Install from PyPI (
pip3 install --upgrade nvitopInstall from conda-forge (
conda install -c conda-forge nvitopInstall the latest version from GitHub (
pip3 install --upgrade pip setuptools
pip3 install git+https://github.com/XuehaiPan/nvitop.git
Or, clone this repo and install manually:
git clone --depth=1 https://github.com/XuehaiPan/nvitop.git && cd nvitop
pip3 install .
NOTE: If you encounter the "nvitop: command not found" error after installation, please check whether you have added the Python console script path (e.g., "${HOME}/.local/bin") to your PATH environment variable. Alternatively, you can use python3 -m nvitop.

MIG Device Support.
Usage
Device and Process Status
Query the device and process status. The output is similar to nvidia-smi, but has been enriched and colorized.
# Query the status of all devices
$ nvitop -1  # or use python3 -m nvitop -1
Specify query devices (by integer indices)
$ nvitop -1 -o 0 1  # only show <GPU 0> and <GPU 1>
Only show devices in CUDAVISIBLEDEVICES (by integer indices or UUID strings)
$ nvitop -1 -ov
Only show GPU processes with the compute context (type: 'C' or 'C+G')
$ nvitop -1 -c
When the -1 switch is on, the result will be displayed ONLY ONCE (same as the default behavior of nvidia-smi). This is much faster and has lower resource usage. See Command Line Options for more command options.
There is also a CLI tool called nvisel that ships with the nvitop PyPI package. See CUDA Visible Devices Selection Tool for more information.
Resource Monitor
Run as a resource monitor:
# Monitor mode (when the display mode is omitted, NVITOPMONITORMODE will be used)
$ nvitop  # or use python3 -m nvitop
Automatically configure the display mode according to the terminal size
$ nvitop -m auto     # shortcut: a key
Arbitrarily display as full mode
$ nvitop -m full     # shortcut: f key
Arbitrarily display as compact mode
$ nvitop -m compact  # shortcut: c key
Specify query devices (by integer indices)
$ nvitop -o 0 1  # only show <GPU 0> and <GPU 1>
Only show devices in CUDAVISIBLEDEVICES (by integer indices or UUID strings)
$ nvitop -ov
Only show GPU processes with the compute context (type: 'C' or 'C+G')
$ nvitop -c
Use ASCII characters only
$ nvitop -U  # useful for terminals without Unicode support
For light terminals
$ nvitop --light
For spectrum-like bar charts (requires the terminal supports 256-color)
$ nvitop --colorful
You can configure the default monitor mode with the NVITOPMONITORMODE environment variable (default auto if not set). See Command Line Options and Environment Variables for more command options.
In monitor mode, you can use Ctrl-c / T / K keys to interrupt / terminate / kill a process. And it's recommended to terminate or kill a process in the tree-view screen (shortcut: t). For normal users, nvitop will shallow other users' processes (in low-intensity colors). For system administrators, you can use sudo nvitop to terminate other users' processes.
To run nvitop as a viewer only and disable all process-mutating shortcuts, pass --readonly (or set NVITOP_M). The signal keys above become no-ops, the on-screen "Press ^C(INT)/T(TERM)/K(KILL) to send signals" hint is hidden, and the corresponding rows in the help screen are dimmed. Use this when sharing a session over SSH, demoing on a multi-tenant box, or wrapping nvitop in a non-admin alias.
Also, to enter the process metrics screen, select a process and then press the Enter / Return key . nvitop dynamically displays the process metrics with live graphs.

Watch metrics for a specific process (shortcut: Enter / Return).
Press h for help or q to return to the terminal. See Keybindings for Monitor Mode for more shortcuts.

nvitop comes with a help screen (shortcut: h).
For Docker Users
Build and run the Docker image with nvidia-container-toolkit:
docker run -it --rm --runtime=nvidia --gpus=all --pid=host ghcr.io/xuehaipan/nvitop:latestNOTE: Don't forget to add the --pid=host option when running the container.
If you only need to set up the Grafana dashboard, you can start a dashboard at http://localhost:3000 with the following command:
docker compose --project-directory=nvitop-exporter/grafana up --build --detachSee nvitop-exporter for more details.
For SSH Users
Run nvitop directly on the SSH session instead of a login shell:
ssh user@host -t nvitop                 # installed by sudo pip3 install ...
ssh user@host -t '~/.local/bin/nvitop'  # installed by pip3 install --user ...
NOTE: Users need to add the -t option to allocate a pseudo-terminal over the SSH session for monitor mode.
Command Line Options and Environment Variables
Type nvitop --help for more command options:
usage: nvitop [--help] [--version] [--once | --monitor [{auto,full,compact}]]
[--interval SEC] [--no-unicode] [--readonly] [--colorful]
[--force-color] [--light] [--gpu-util-thresh th1 th2]
[--mem-util-thresh th1 th2] [--only INDEX [INDEX ...]]
[--only-visible] [--compute] [--only-compute] [--graphics]
[--only-graphics] [--user [USERNAME ...]] [--pid PID [PID ...]]
An interactive NVIDIA-GPU process viewer.
options: --help, -h Show this help message and exit. --version, -V Show nvitop's version number and exit. --once, -1 Report query data only once. --monitor, -m [{auto,full,compact}] Run as a resource monitor. Continuously report query data and handle user inputs. If the argument is omitted, the value from NVITOPMONITORMODE will be used. (default fallback mode: auto) --interval SEC Process status update interval in seconds. (default: 2) --no-unicode, --ascii, -U Use ASCII characters only, which is useful for terminals without Unicode support. --readonly Disable all system and process changing features (e.g., terminating processes). Set variable NVITOP_M for convenience.
coloring: --colorful Use gradient colors to get spectrum-like bar charts. Set variable NVITOP_M for convenience. This option is only available when the terminal supports 256 colors. You may need to set environment variable TERM="xterm-256color". Note that the terminal multiplexer, such as tmux, may override the TERM variable. --force-color Force colorize even when stdout is not a TTY terminal. --light Tweak visual results for light theme terminals in monitor mode. Set variable NVITOP_M on light terminals for convenience. --gpu-util-thresh th1 th2 Thresholds of GPU utilization to determine the load intensity. Coloring rules: light < th1 % <= moderate < th2 % <= heavy. ( 1 <= th1 < th2 <= 99, defaults: 10 75 ) --mem-util-thresh th1 th2 Thresholds of GPU memory percent to determine the load intensity. Coloring rules: light < th1 % <= moderate < th2 % <= heavy. ( 1 <= th1 < th2 <= 99, defaults: 10 80 )
device filtering: --only, -o INDEX [INDEX ...] Only show the specified devices, suppress option --only-visible. --only-visible, -ov Only show devices in the CUDAVISIBLEDEVICES environment variable.
process filtering: --compute, -c Only show GPU processes with the compute context. (type: 'C' or 'C+G') --only-compute, -C Only show GPU processes exactly with the compute context. (type: 'C' only) --graphics, -g Only show GPU processes with the graphics context. (type: 'G' or 'C+G') --only-graphics, -G Only show GPU processes exactly with the graphics context. (type: 'G' only) --user, -u [USERNAME ...] Only show processes of the given users (or $USER for no argument). --pid, -p PID [PID ...] Only show processes of the given PIDs.
nvitop can accept the following environment variables for monitor mode:
| Name | Description | Valid Values | Default Value | | -------------------------------------- | --------------------------------------------------- | --------------------------------------------------------------------------------------------------------------------------- | ----------------- | | NVITOPMONITORMODE | The default display mode (a comma-separated string) | auto / full / compactplain / colorfuldark / lightreadonly (disables process-mutating shortcuts) | auto,plain,dark | | NVITOPGPUUTILIZATION_THRESHOLDS | Thresholds of GPU utilization | 10,75 , 1,99, ... | 10,75 | | NVITOPMEMORYUTILIZATION_THRESHOLDS | Thresholds of GPU memory percent | 10,80 , 1,99, ... | 10,80 | | LOGLEVEL | Log level for log messages | DEBUG , INFO, WARNING, ... | WARNING |
For example:
# Replace the following export statements if you are not using Bash / Zsh
export NVITOP_M
Full monitor mode with light terminal tweaks
nvitop
For convenience, you can add these environment variables to your shell startup file, e.g.:
# For Bash
echo 'export NVITOP_M' >> ~/.bashrc
For Zsh
echo 'export NVITOP_M' >> ~/.zshrc
For Fish
echo 'set -gx NVITOPMONITORMODE "full"' >> ~/.config/fish/config.fish
For PowerShell
'$Env:NVITOPMONITORMODE = "full"' >> $PROFILE.CurrentUserAllHosts
Keybindings for Monitor Mode
| Key | Binding | | -------------------------------------------------------------------------: | :----------------------------------------------------------------------------------------- | | q | Quit and return to the terminal. | | h / ? | Go to the help screen. | | a / f / c | Change the display mode to auto / full / compact. | | r / <C-r> / <F5> | Force refresh the window. | | | | | <Up> / <Down><A-k> / <A-j><Tab> / <S-Tab><Wheel> | Select and highlight a process. | | <Left> / <Right><A-h> / <A-l><S-Wheel> | Scroll the host information of processes. | | <Home> | Select the first process. | | <End> | Select the last process. | | <C-a>^ | Scroll left to the beginning of the process entry (i.e. beginning of line). | | <C-e>$ | Scroll right to the end of the process entry (i.e. end of line). | | <PageUp> / <PageDown>
<A-K> / <A-J>[ / ] | scroll entire screen (for large amounts of processes). | | | | | <Space> | Tag/untag current process. | | <Esc> | Clear process selection. | | <C-c>I | Send signal.SIGINT to the selected process (interrupt). (disabled under --readonly) | | T | Send signal.SIGTERM to the selected process (terminate). (disabled under --readonly) | | K | Send signal.SIGKILL to the selected process (kill). (disabled under --readonly) | | | | | e | Show process environment. | | t | Toggle tree-view screen. | | <Enter> | Show process metrics. | | | | | , / . | Select the sort column. | | / | Reverse the sort order. | | on (oN) | Sort processes in the natural order, i.e., in ascending (descending) order of GPU. | | ou (oU) | Sort processes by USER in ascending (descending) order. | | op (oP) | Sort processes by PID in descending (ascending) order. | | og (oG) | Sort processes by GPU-MEM in descending (ascending) order. | | os (oS) | Sort processes by %SM in descending (ascending) order. | | oc (oC) | Sort processes by %CPU in descending (ascending) order. | | om (oM) | Sort processes by %MEM in descending (ascending) order. | | ot (oT) | Sort processes by TIME in descending (ascending) order. |
HINT: It's recommended to terminate or kill a process in the tree-view screen (shortcut: t).
CUDA Visible Devices Selection Tool
Automatically select CUDAVISIBLEDEVICES from the given criteria. Example usage of the CLI tool:
# All devices but sorted
$ nvisel       # or use python3 -m nvitop.select
6,5,4,3,2,1,0,7,8
A simple example to select 4 devices
$ nvisel -n 4  # or use python3 -m nvitop.select -n 4
6,5,4,3
Select available devices that satisfy the given constraints
$ nvisel --min-count 2 --max-count 3 --min-free-memory 5GiB --max-gpu-utilization 60
6,5,4
Set CUDAVISIBLEDEVICES environment variable using nvisel
$ export CUDADEVICEORDER="PCIBUSID" CUDAVISIBLEDEVICES="$(nvisel -c 1 -f 10GiB)"
CUDAVISIBLEDEVICES="6,5,4,3,2,1,0"
Use UUID strings in CUDAVISIBLEDEVICES environment variable
$ export CUDAVISIBLEDEVICES="$(nvisel -O uuid -c 2 -f 5000M)"
CUDAVISIBLEDEVICES="GPU-849d5a8d-610e-eeea-1fd4-81ff44a23794,GPU-18ef14e9-dec6-1d7e-1284-3010c6ce98b1,GPU-96de99c9-d68f-84c8-424c-7c75e59cc0a0,GPU-2428d171-8684-5b64-830c-435cd972ec4a,GPU-6d2a57c9-7783-44bb-9f53-13f36282830a,GPU-f8e5a624-2c7e-417c-e647-b764d26d4733,GPU-f9ca790e-683e-3d56-00ba-8f654e977e02"
Pipe output to other shell utilities
$ nvisel --newline -O uuid -C 6 -f 8GiB
GPU-849d5a8d-610e-eeea-1fd4-81ff44a23794
GPU-18ef14e9-dec6-1d7e-1284-3010c6ce98b1
GPU-96de99c9-d68f-84c8-424c-7c75e59cc0a0
GPU-2428d171-8684-5b64-830c-435cd972ec4a
GPU-6d2a57c9-7783-44bb-9f53-13f36282830a
GPU-f8e5a624-2c7e-417c-e647-b764d26d4733
$ nvisel -0 -O uuid -c 2 -f 4GiB | xargs -0 -I {} nvidia-smi --id={} --query-gpu=index,memory.free --format=csv
CUDAVISIBLEDEVICES="GPU-849d5a8d-610e-eeea-1fd4-81ff44a23794,GPU-18ef14e9-dec6-1d7e-1284-3010c6ce98b1,GPU-96de99c9-d68f-84c8-424c-7c75e59cc0a0,GPU-2428d171-8684-5b64-830c-435cd972ec4a,GPU-6d2a57c9-7783-44bb-9f53-13f36282830a,GPU-f8e5a624-2c7e-417c-e647-b764d26d4733,GPU-f9ca790e-683e-3d56-00ba-8f654e977e02"
index, memory.free [MiB]
6, 11018 MiB
index, memory.free [MiB]
5, 11018 MiB
index, memory.free [MiB]
4, 11018 MiB
index, memory.free [MiB]
3, 11018 MiB
index, memory.free [MiB]
2, 11018 MiB
index, memory.free [MiB]
1, 11018 MiB
index, memory.free [MiB]
0, 11018 MiB
Normalize the CUDAVISIBLEDEVICES environment variable (e.g. convert UUIDs to indices or get full UUIDs for an abbreviated form)
$ nvisel -i "GPU-18ef14e9,GPU-849d5a8d" -S
5,6
$ nvisel -i "GPU-18ef14e9,GPU-849d5a8d" -S -O uuid --newline
GPU-18ef14e9-dec6-1d7e-1284-3010c6ce98b1
GPU-849d5a8d-610e-eeea-1fd4-81ff44a23794
You can also integrate nvisel into your training script like this:
# Put this at the top of the Python script
import os
from nvitop import select_devices
os.environ['CUDAVISIBLEDEVICES'] = ','.join(     selectdevices(format='uuid', mincount=4, minfreememory='8GiB') )
Type nvisel --help for more command options:
usage: nvisel [--help] [--version]
              [--inherit [CUDAVISIBLEDEVICES]] [--account-as-free [USERNAME ...]]
              [--min-count N] [--max-count N] [--count N]
              [--min-free-memory SIZE] [--min-total-memory SIZE]
              [--max-gpu-utilization RATE] [--max-memory-utilization RATE]
              [--tolerance TOL]
              [--format FORMAT] [--sep SEP | --newline | --null] [--no-sort]
CUDA visible devices selection tool.
options:   --help, -h            Show this help message and exit.   --version, -V         Show nvisel's version number and exit.
constraints:   --inherit [CUDAVISIBLEDEVICES], -i [CUDAVISIBLEDEVICES]                         Inherit the given CUDAVISIBLEDEVICES. If the argument is omitted, use the                         value from the environment. This means selecting a subset of the currently                         CUDA-visible devices.   --account-as-free [USERNAME ...]                         Account the used GPU memory of the given users as free memory.                         If this option is specified but without argument, $USER will be used.   --min-count N, -c N   Minimum number of devices to select. (default: 0)                         The tool will fail (exit non-zero) if the requested resource is not available.   --max-count N, -C N   Maximum number of devices to select. (default: all devices)   --count N, -n N       Overriding both --min-count N and --max-count N.   --min-free-memory SIZE, -f SIZE                         Minimum free memory of devices to select. (example value: 4GiB)                         If this constraint is given, check against all devices.   --min-total-memory SIZE, -t SIZE                         Minimum total memory of devices to select. (example value: 10GiB)                         If this constraint is given, check against all devices.   --max-gpu-utilization RATE, -G RATE                         Maximum GPU utilization rate of devices to select. (example value: 30)                         If this constraint is given, check against all devices.   --max-memory-utilization RATE, -M RATE                         Maximum memory bandwidth utilization rate of devices to select. (example value: 50)                         If this constraint is given, check against all devices.   --tolerance TOL, --tol TOL                         The constraints tolerance (in percentage). (default: 0, i.e., strict)                         This option can loose the constraints if the requested resource is not available.                         For example, set --tolerance=20 will accept a device with only 4GiB of free                         memory when set --min-free-memory=5GiB.
formatting:   --format FORMAT, -O FORMAT                         The output format of the selected device identifiers. (default: index)                         If any MIG device found, the output format will be fallback to uuid.   --sep SEP, --separator SEP, -s SEP                         Separator for the output. (default: ',')   --newline             Use newline character as separator for the output, equivalent to --sep=$'\n'.   --null, -0            Use null character ('\x00') as separator for the output. This option corresponds                         to the -0 option of xargs.   --no-sort, -S         Do not sort the device by memory usage and GPU utilization.
More than a Monitor
nvitop can be easily integrated into other applications. You can use nvitop to make your own monitoring tools. The full API references host at examples/.
A browser dashboard example built on top of nvitop.collectinbackground.
Quick Start
A minimal script to monitor the GPU devices based on APIs from nvitop:
from nvitop import Device
devices = Device.all()  # or Device.cuda.all() to use CUDA ordinal instead for device in devices:     processes = device.processes()  # type: Dict[int, GpuProcess]     sorted_pids = sorted(processes.keys())
print(device)     print(f'  - Fan speed:       {device.fan_speed()}%')     print(f'  - Temperature:     {device.temperature()}C')     print(f'  - GPU utilization: {device.gpu_utilization()}%')     print(f'  - Total memory:    {device.memorytotalhuman()}')     print(f'  - Used memory:     {device.memoryusedhuman()}')     print(f'  - Free memory:     {device.memoryfreehuman()}')     print(f'  - Processes ({len(processes)}): {sorted_pids}')     for pid in sorted_pids:         print(f'    - {processes[pid]}')     print('-' * 120)
Another more advanced approach with coloring:
import time
from nvitop import Device, GpuProcess, NA, colored
print(colored(time.strftime('%a %b %d %H:%M:%S %Y'), color='red', attrs=('bold',)))
devices = Device.cuda.all()  # or Device.all() to use NVML ordinal instead separator = False for device in devices:     processes = device.processes()  # type: Dict[int, GpuProcess]
print(colored(str(device), color='green', attrs=('bold',)))     print(colored('  - Fan speed:       ', color='blue', attrs=('bold',)) + f'{device.fan_speed()}%')     print(colored('  - Temperature:     ', color='blue', attrs=('bold',)) + f'{device.temperature()}C')     print(colored('  - GPU utilization: ', color='blue', attrs=('bold',)) + f'{device.gpu_utilization()}%')     print(colored('  - Total memory:    ', color='blue', attrs=('bold',)) + f'{device.memorytotalhuman()}')     print(colored('  - Used memory:     ', color='blue', attrs=('bold',)) + f'{device.memoryusedhuman()}')     print(colored('  - Free memory:     ', color='blue', attrs=('bold',)) + f'{device.memoryfreehuman()}')     if len(processes) > 0:         processes = GpuProcess.take_snapshots(processes.values(), failsafe=True)         processes.sort(key=lambda process: (process.username, process.pid))
print(colored(f'  - Processes ({len(processes)}):', color='blue', attrs=('bold',)))         fmt = '    {pid:<5}  {username:<8} {cpu:>5}  {hostmemory:>8} {time:>8}  {gpumemory:>8}  {sm:>3}  {command:<}'.format         print(colored(fmt(pid='PID', username='USERNAME',                           cpu='CPU%', host_memory='HOST-MEM', time='TIME',                           gpu_memory='GPU-MEM', sm='SM%',                           command='COMMAND'),                       attrs=('bold',)))         for snapshot in processes:             print(fmt(pid=snapshot.pid,                       username=snapshot.username[:7] + ('+' if len(snapshot.username) > 8 else snapshot.username[7:8]),                       cpu=snapshot.cpupercent, hostmemory=snapshot.hostmemoryhuman,                       time=snapshot.runningtimehuman,                       gpumemory=(snapshot.gpumemoryhuman if snapshot.gpumemory_human is not NA else 'WDDM:N/A'),                       sm=snapshot.gpusmutilization,                       command=snapshot.command))     else:         print(colored('  - No Running Processes', attrs=('bold',)))
if separator:         print('-' * 120)     separator = True

An example monitoring script built with APIs from nvitop.
Status Snapshot
nvitop provides a helper function takesnapshots to retrieve the status of both GPU devices and GPU processes at once. You can type help(nvitop.takesnapshots) in Python REPL for detailed documentation.
In [1]: from nvitop import take_snapshots, Device ...: import os ...: os.environ['CUDADEVICEORDER'] = 'PCIBUSID' ...: os.environ['CUDAVISIBLEDEVICES'] = '1,0' # comma-separated integers or UUID stringsOut[2]: SnapshotResult( devices=[ DeviceSnapshot( real=Device(index=0, ...), ... ), ... ], gpu_processes=[ GpuProcessSnapshot( real=GpuProcess(pid=xxxxxx, device=Device(index=0, ...), ...), ... ), ... ] )In [2]: takesnapshots() # equivalent to
takesnapshots(Device.all())In [3]: devicesnapshots, gpuprocesssnapshots = takesnapshots(Device.all()) # type: Tuple[List[DeviceSnapshot], List[GpuProcessSnapshot]]
In [4]: devicesnapshots, = takesnapshots(gpuprocesses=False) # ignore process snapshots
In [5]: take_snapshots(Device.cuda.all()) # use CUDA device enumeration Out[5]: SnapshotResult( devices=[ CudaDeviceSnapshot( real=CudaDevice(cudaindex=0, nvmlindex=1, ...), ... ), CudaDeviceSnapshot( real=CudaDevice(cudaindex=1, nvmlindex=0, ...), ... ), ], gpu_processes=[ GpuProcessSnapshot( real=GpuProcess(pid=xxxxxx, device=CudaDevice(cuda_index=0, ...), ...), ... ), ... ] )
In [6]: take_snapshots(Device.cuda(1)) # <CUDA 1> only Out[6]: SnapshotResult( devices=[ CudaDeviceSnapshot( real=CudaDevice(cudaindex=1, nvmlindex=0, ...), ... ) ], gpu_processes=[ GpuProcessSnapshot( real=GpuProcess(pid=xxxxxx, device=CudaDevice(cuda_index=1, ...), ...), ... ), ... ] )
Please refer to section Low-level APIs for more information.
Resource Metric Collector
ResourceMetricCollector is a class that collects resource metrics for host, GPUs and processes running on the GPUs. All metrics will be collected in an asynchronous manner. You can type help(nvitop.ResourceMetricCollector) in Python REPL for detailed documentation.
In [1]: from nvitop import ResourceMetricCollector, Device
   ...: import os
   ...: os.environ['CUDADEVICEORDER'] = 'PCIBUSID'
   ...: os.environ['CUDAVISIBLEDEVICES'] = '3,2,1,0'  # comma-separated integers or UUID strings
In [2]: collector = ResourceMetricCollector()                                   # log all devices and descendant processes of the current process on the GPUs In [3]: collector = ResourceMetricCollector(root_pids={1})                      # log all devices and all GPU processes In [4]: collector = ResourceMetricCollector(devices=Device(0), root_pids={1})   # log <GPU 0> and all GPU processes on <GPU 0> In [5]: collector = ResourceMetricCollector(devices=Device.cuda.all())          # use the CUDA ordinal
In [6]: with collector(tag='<tag>'):    ...:     # Do something    ...:     collector.collect()  # -> Dict[str, float] key -> '<tag>/<scope>/<metric (unit)>/<mean/min/max>' {     '<tag>/host/cpu_percent (%)/mean': 8.967849777683456,     '<tag>/host/cpu_percent (%)/min': 6.1,     '<tag>/host/cpu_percent (%)/max': 28.1,     ...,     '<tag>/host/memory_percent (%)/mean': 21.5,     '<tag>/host/swap_percent (%)/mean': 0.3,     '<tag>/host/memory_used (GiB)/mean': 91.0136418208109,     '<tag>/host/load_average (%) (1 min)/mean': 10.251427386878328,     '<tag>/host/load_average (%) (5 min)/mean': 10.072539414569503,     '<tag>/host/load_average (%) (15 min)/mean': 11.91126970422139,     ...,     '<tag>/cuda:0 (gpu:3)/memory_used (MiB)/mean': 3.875,     '<tag>/cuda:0 (gpu:3)/memory_free (MiB)/mean': 11015.562499999998,     '<tag>/cuda:0 (gpu:3)/memory_total (MiB)/mean': 11019.437500000002,     '<tag>/cuda:0 (gpu:3)/memory_percent (%)/mean': 0.0,     '<tag>/cuda:0 (gpu:3)/gpu_utilization (%)/mean': 0.0,     '<tag>/cuda:0 (gpu:3)/memory_utilization (%)/mean': 0.0,     '<tag>/cuda:0 (gpu:3)/fan_speed (%)/mean': 22.0,     '<tag>/cuda:0 (gpu:3)/temperature (C)/mean': 25.0,     '<tag>/cuda:0 (gpu:3)/power_usage (W)/mean': 19.11166264116916,     ...,     '<tag>/cuda:1 (gpu:2)/memory_used (MiB)/mean': 8878.875,     ...,     '<tag>/cuda:2 (gpu:1)/memory_used (MiB)/mean': 8182.875,     ...,     '<tag>/cuda:3 (gpu:0)/memory_used (MiB)/mean': 9286.875,     ...,     '<tag>/pid:12345/host/cpu_percent (%)/mean': 151.34342772112265,     '<tag>/pid:12345/host/host_memory (MiB)/mean': 44749.72373447514,     '<tag>/pid:12345/host/hostmemorypercent (%)/mean': 8.675082352111717,     '<tag>/pid:12345/host/running_time (min)': 336.23803206741576,     '<tag>/pid:12345/cuda:1 (gpu:4)/gpu_memory (MiB)/mean': 8861.0,     '<tag>/pid:12345/cuda:1 (gpu:4)/gpumemorypercent (%)/mean': 80.4,     '<tag>/pid:12345/cuda:1 (gpu:4)/gpumemoryutilization (%)/mean': 6.711118172407917,     '<tag>/pid:12345/cuda:1 (gpu:4)/gpusmutilization (%)/mean': 48.23283397736476,     ...,     '<tag>/duration (s)': 7.247399162035435,     '<tag>/timestamp': 1655909466.9981883 }
The results can be easily logged into TensorBoard or a CSV file. For example:
import os
import torch import torch.nn as nn import torch.nn.functional as F from torch.utils.tensorboard import SummaryWriter
from nvitop import CudaDevice, ResourceMetricCollector
def addscalardict(writer, maintag, tagscalardict, globalstep=None, walltime=None):     for tag, scalar in tagscalardict.items():         writer.addscalar(f'{maintag}/{tag}', scalar, globalstep=globalstep, walltime=walltime)
Build networks and prepare datasets
...
Logger and status collector
writer = SummaryWriter()
collector = ResourceMetricCollector(devices=CudaDevice.all(),  # log all visible CUDA devices and use the CUDA ordinal
                                    root_pids={os.getpid()},   # only log the descendant processes of the current process
                                    interval=1.0)              # snapshot interval for background daemon thread
Start training
global_step = 0
for epoch in range(num_epoch):
    with collector(tag='train'):
        for batch in train_dataset:
            with collector(tag='batch'):
                metrics = train(net, batch)
                global_step += 1
                addscalardict(writer, 'train', metrics, globalstep=globalstep)
                addscalardict(writer, 'resources',      # tag='resources/train/batch/...'
                                collector.collect(),
                                globalstep=globalstep)
addscalardict(writer, 'resources',              # tag='resources/train/...'                         collector.collect(),                         global_step=epoch)
with collector(tag='validate'):         metrics = validate(net, validation_dataset)         addscalardict(writer, 'validate', metrics, global_step=epoch)         addscalardict(writer, 'resources',              # tag='resources/validate/...'                         collector.collect(),                         global_step=epoch)
Another example for logging into a CSV file:
import datetime
import time
import pandas as pd
from nvitop import ResourceMetricCollector
collector = ResourceMetricCollector(root_pids={1}, interval=2.0)  # log all devices and all GPU processes df = pd.DataFrame()
with collector(tag='resources'):     for _ in range(60):         # Do something         time.sleep(60)
metrics = collector.collect()         dfmetrics = pd.DataFrame.fromrecords(metrics, index=[len(df)])         df = pd.concat([df, dfmetrics], ignoreindex=True)         # Flush to CSV file ...
df.insert(0, 'time', df['resources/timestamp'].map(datetime.datetime.fromtimestamp)) df.to_csv('results.csv', index=False)
You can also daemonize the collector in the background using collectinbackground or ResourceMetricCollector.daemonize with callback functions.
from nvitop import Device, ResourceMetricCollector, collectinbackground
logger = ...
def on_collect(metrics):  # will be called periodically     if logger.is_closed():  # closed manually by user         return False     logger.log(metrics)     return True
def on_stop(collector):  # will be called only once at stop     if not logger.is_closed():         logger.close()  # cleanup
Record metrics to the logger in the background every 5 seconds.
It will collect 5-second mean/min/max for each metric.
collectinbackground(
    on_collect,
    ResourceMetricCollector(Device.cuda.all()),
    interval=5.0,
    onstop=onstop,
)
or simply:
ResourceMetricCollector(Device.cuda.all()).daemonize(
    on_collect,
    interval=5.0,
    onstop=onstop,
)
Low-level APIs
The full API references can be found at
Device
The device module provides:
|
Live class of the GPU devices, different from the device snapshots. |
|
Class for physical devices. |
|
Class for MIG devices. |
|
Class for devices enumerated over the CUDA ordinal. |
|
Class for CUDA devices that are MIG devices. |
|
Parse the given |
|
Parse the given |
``python In [1]: from nvitop import ( ...: host, ...: Device, PhysicalDevice, CudaDevice, ...: parsecudavisibledevices, normalizecudavisibledevices ...: HostProcess, GpuProcess, ...: NA, ...: ) ...: import os ...: os.environ['CUDADEVICEORDER'] = 'PCIBUSID' ...: os.environ['CUDAVISIBLEDEVICES'] = '9,8,7,6' # comma-separated integers or UUID strings
In [2]: Device.driver_version() Out[2]: '525.60.11'
In [3]: Device.cudadriverversion() # the maximum CUDA version supported by the driver (can be different from the CUDA Runtime version) Out[3]: '12.0'
In [4]: Device.cudaruntimeversion() # the CUDA Runtime version Out[4]: '11.8'
In [5]: Device.count() Out[5]: 10
In [6]: CudaDevice.count() # or Device.cuda.count() Out[6]: 4
In [7]: all_devices = Device.all() # all devices on board (physical device) ...: nvidia0, nvidia1 = Device.from_indices([0, 1]) # from physical device indices ...: all_devices Out[7]: [ PhysicalDevice(index=0, name="GeForce RTX 2080 Ti", total_memory=11019MiB), PhysicalDevice(index=1, name="GeForce RTX 2080 Ti", total_memory=11019MiB), PhysicalDevice(index=2, name="GeForce RTX 2080 Ti", total_memory=11019MiB), PhysicalDevice(index=3, name="GeForce RTX 2080 Ti", total_memory=11019MiB), PhysicalDevice(index=4, name="GeForce RTX 2080 Ti", total_memory=11019MiB), PhysicalDevice(index=5, name="GeForce RTX 2080 Ti", total_memory=11019MiB), PhysicalDevice(index=6, name="GeForce RTX 2080 Ti", total_memory=11019MiB), PhysicalDevice(index=7, name="GeForce RTX 2080 Ti", total_memory=11019MiB), PhysicalDevice(index=8, name="GeForce RTX 2080 Ti", total_memory=11019MiB), PhysicalDevice(index=9, name="GeForce RTX 2080 Ti", total_memory=11019MiB) ]
In [8]: # NOTE: The function results might be different between calls when the CUDAVISIBLEDEVICES environment variable has been modified ...: cudavisibledevices = Device.fromcudavisibledevices() # from the CUDAVISIBLE_DEVICES environment variable ...: cuda0, cuda1 = Device.fromcudaindices([0, 1]) # from CUDA device indices (might be different from physical device indices if CUDAVISIBLEDEVICES is set) ...: cudavisibledevices = CudaDevice.all() # shortcut to Device.fromcudavisible_devices() ...: cudavisibledevices = Device.cuda.all() # Device.cuda is aliased to CudaDevice ...: cudavisibledevices Out[8]: [ CudaDevice(cudaindex=0, nvmlindex=9, name="NVIDIA GeForce RTX 2080 Ti", total_memory=11019MiB), CudaDevice(cudaindex=1, nvmlindex=8, name="NVIDIA GeForce RTX 2080 Ti", total_memory=11019MiB), CudaDevice(cudaindex=2, nvmlindex=7, name="NVIDIA GeForce RTX 2080 Ti", total_memory=11019MiB), CudaDevice(cudaindex=3, nvmlindex=6, name="NVIDIA GeForce RTX 2080 Ti", total_memory=11019MiB) ]
In [9]: nvidia0 = Device(0) # from device index (or Device(index=0)) ...: nvidia0 Out[9]: PhysicalDevice(index=0, name="GeForce RTX 2080 Ti", total_memory=11019MiB)
In [10]: nvidia1 = Device(uuid='GPU-01234567-89ab-cdef-0123-456789abcdef') # from UUID string (or just Device('GPU-xxxxxxxx-...')) ...: nvidia2 = Device(bus_id='00000000:06:00.0') # from PCI bus ID ...: nvidia1 Out[10]: PhysicalDevice(index=1, name="GeForce RTX 2080 Ti", total_memory=11019MiB)
In [11]: cuda0 = CudaDevice(0) # from CUDA device index (equivalent to CudaDevice(cuda_index=0)) ...: cuda1 = CudaDevice(nvml_index=8) # from physical device index ...: cuda3 = CudaDevice(uuid='GPU-xxxxxxxx-...') # from UUID string ...: cuda4 = Device.cuda(4) # Device.cuda is aliased to CudaDevice ...: cuda0 Out[11]: CudaDevice(cudaindex=0, nvmlindex=9, name="NVIDIA GeForce RTX 2080 Ti", total_memory=11019MiB)
In [12]: nvidia0.memory_used() # in bytes Out[12]: 9293398016
In [13]: nvidia0.memoryusedhuman() Out[13]: '8862MiB'
In [14]: nvidia0.gpu_utilization() # in percentage Out[14]: 5
In [15]: nvidia0.processes() # type: Dict[int, GpuProcess] Out[15]: { 52059: GpuProcess(pid=52059, gpumemory=7885MiB, type=C, device=PhysicalDevice(index=0, name="GeForce RTX 2080 Ti", totalmemory=11019MiB), host=HostProcess(pid=52059, name='ipython3', status='sleeping', started='14:31:22')), 53002: GpuProcess(pid=53002, gpumemory=967MiB, type=C, device=PhysicalDevice(index=0, name="GeForce RTX 2080 Ti", totalmemory=11019MiB), host=HostProcess(pid=53002, name='python', status='running', started='14:31:59')) }
In [16]: nvidia1snapshot = nvidia1.assnapshot() ...: nvidia1_snapshot Out[16]: PhysicalDeviceSnapshot( real=PhysicalDevice(index=1, name="GeForce RTX 2080 Ti", total_memory=11019MiB), bus_id='00000000:05:00.0', compute_mode='Default', clock_infos=ClockInfos(graphics=1815, sm=1815, memory=6800, video=1680), # in MHz clockspeedinfos=ClockSpeedInfos(current=ClockInfos(graphics=1815, sm=1815, memory=6800, video=1680), max=ClockInfos(graphics=2100, sm=2100, memory=7000, video=1950)), # in MHz cudacomputecapability=(7, 5), currentdrivermodel='N/A', decoder_utilization=0, # in percentage display_active='Disabled', display_mode='Disabled', encoder_utilization=0, # in percentage fan_speed=22, # in percentage gpu_utilization=17, # in percentage (NOTE: this is the utilization rate of SMs, i.e. GPU percent) index=1, maxclockinfos=ClockInfos(graphics=2100, sm=2100, memory=7000, video=1950), # in MHz memory_clock=6800, # in MHz memory_free=10462232576, # in bytes memoryfreehuman='9977MiB', memory_info=MemoryInfo(total=11554717696, free=10462232576, used=1092485120) # in bytes memory_percent=9.5, # in percentage (NOTE: this is the percentage of used GPU memory) memory_total=11554717696, # in bytes memorytotalhuman='11019MiB', memory_usage='1041MiB / 11019MiB', memory_used=1092485120, # in bytes memoryusedhuman='1041MiB', memory_utilization=7, # in percentage (NOTE: this is the utilization rate of GPU memory bandwidth) mig_mode='N/A', name='GeForce RTX 2080 Ti', pcierxthroughput=1000, # in KiB/s pcierxthroughput_human='1000KiB/s', pcie_throughput=ThroughputInfo(tx=1000, rx=1000), # in KiB/s pcietxthroughput=1000, # in KiB/s pcietxthroughput_human='1000KiB/s', performance_state='P2', persistence_mode='Disabled', power_limit=250000, # in milliwatts (mW) power_status='66W / 250W', # in watts (W) power_usage=66051, # in milliwatts (mW) sm_clock=1815, # in MHz temperature=39, # in Celsius totalvolatileuncorrectedeccerrors='N/A', utilization_rates=UtilizationRates(gpu=17, memory=7, encoder=0, decoder=0), # in percentage uuid='GPU-01234567-89ab-cdef-0123-456789abcdef', )
In [17]: nvidia1snapshot.memorypercent # snapshot uses properties instead of function calls Out[17]: 9.5
In [18]: nvidia1snapshot['memoryinfo'] # snapshot also supports getitem` by string Out[18]: MemoryInfo(total=11554717696, free=10462232576, used=1092485120)
In [19]: nvidia1snapshot.bar1memory_info # snapshot will
README truncated. View on GitHub


