
Local-first flight recorder for coding agents : replay every run as a live session map, score the context bill, and write the fix back into AGENTS.md — no API key, one npx command.
Agent-Blackbox
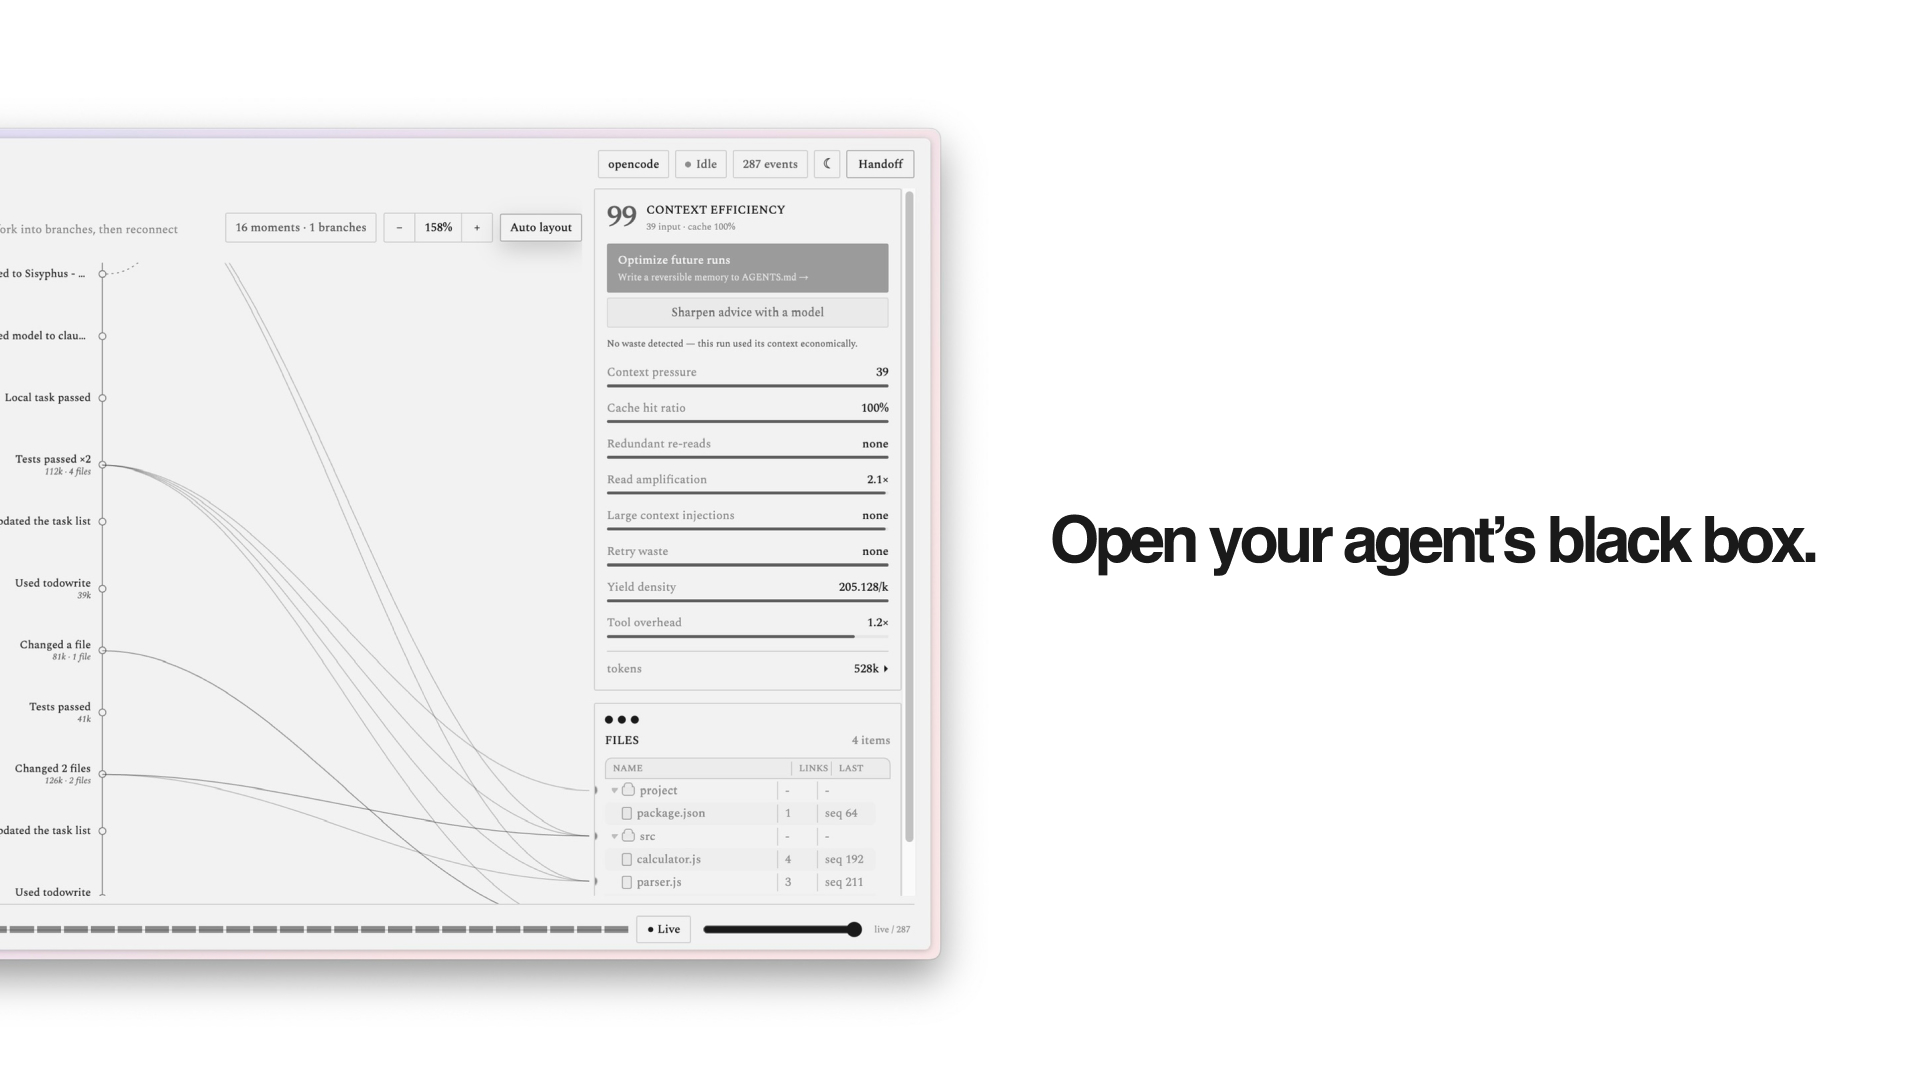
Open your coding agent's black box.


Agent-Blackbox is a local-first flight recorder and context-efficiency profiler for coding agents. It turns every agent run into a live, replayable operational graph — what the agent read, changed, ran, decided, delegated, blocked on, and verified — reconstructed from observed events, not from the agent's own summary. Then it scores the run on two axes — how economically it used its context window, and whether the task actually landed — judged on a yardstick that fits the task type (research / debug / ops…) and your own past runs, and tells you, concretely, how to make the next one cheaper and faster.
Works with Claude Code and OpenCode — same recorder, same map, same efficiency score. Record either, or both at once.
"The transcript is what the agent said. The black box is what it did — and what it cost."
Why Agent-Blackbox
You can't just ask the agent what a task cost. A 2026 study of eight frontier models on agentic coding (SWE-bench Verified) found they predict their own token usage with a correlation of just 0.39 — and systematically underestimate the real bill. Same task, same model: runs vary up to 30× in tokens. Expert difficulty ratings barely track real cost. And agentic runs already burn ~1000× more tokens than ordinary coding, almost all of it input context.
So don't ask — measure. Agent-Blackbox replays every run as an observed session map, scores exactly what it cost, and writes the fix back.
Bai et al., How Do AI Agents Spend Your Money? Analyzing and Predicting Token Consumption in Agentic Coding Tasks, arXiv:2604.22750 (2026).
Quickstart
One command. Works with Claude Code and OpenCode (needs Node 20+):
# Record Claude Code — nothing to install; the daemon tails the session
transcripts it already writes (~/.claude/projects/)
npx @taewooopark/agent-blackbox up --host claude-code
…or record OpenCode (installs the recorder into OpenCode's global plugin dir)
npx @taewooopark/agent-blackbox up
…or record both hosts at once, into one dashboard
npx @taewooopark/agent-blackbox up --host all
Either way it starts the daemon and opens the dashboard (http://127.0.0.1:5173/; add --no-open to skip). Now use the agent exactly the way you already do — the map fills in live:
claude            # Claude Code, in any folder — zero setup, just run it
opencode # …or OpenCode (terminal or the desktop app)- Claude Code needs no install at all — the daemon tails the JSONL transcripts the CLI already writes, so any folder, any session is recorded the moment you run
claude. (Add--optimizeto also install the opt-in in-run actuator hooks.) - OpenCode records via a recorder dropped into its global plugin directory (
~/.config/opencode/plugins/) — any session, any folder, the desktop app included. - Gajae-Code (experimental) —
--host gjctails Gajae-Code sessions (~/.gjc/agent/sessions/), no install; also covered by--host all.
npx @taewooopark/agent-blackbox uninstall.
Scope OpenCode to one project, or run from source
# Record just one OpenCode project (recorder lands in <dir>/.opencode instead of globally)
npx @taewooopark/agent-blackbox up --project /path/to/your/project
From source (development / contributing)
git clone https://github.com/TaewoooPark/Agent-Blackbox
cd Agent-Blackbox && npm install && npm run build:cli
node packages/cli/dist/cli.js up --host claude-code   # or: up | up --host all
The map assembles itself live. That's it.
Recipes
# Just watch Claude Code — start it once, then use claude anywhere
npx @taewooopark/agent-blackbox up --host claude-code
claude   # in any folder; the dashboard fills in live
Record both hosts together, with tailored fixes from a free/local model
npx @taewooopark/agent-blackbox up --host all --suggest ollama --suggest-model qwen2.5-coder
Multi-agent: just delegate in your normal session — each subagent forks into its own lane
claude "Delegate exploration, implementation, and tests to subagents, then summarize."
Resume elsewhere: open the run, click Handoff, copy the Markdown into the next session
Pick a different port if 47831/5173 are taken (the recorder is re-stamped to match)
npx @taewooopark/agent-blackbox up --host claude-code --port 48000 --ui-port 4000
Stop recording (removes the global recorder + any Claude Code hooks)
npx @taewooopark/agent-blackbox uninstall
Two things at once
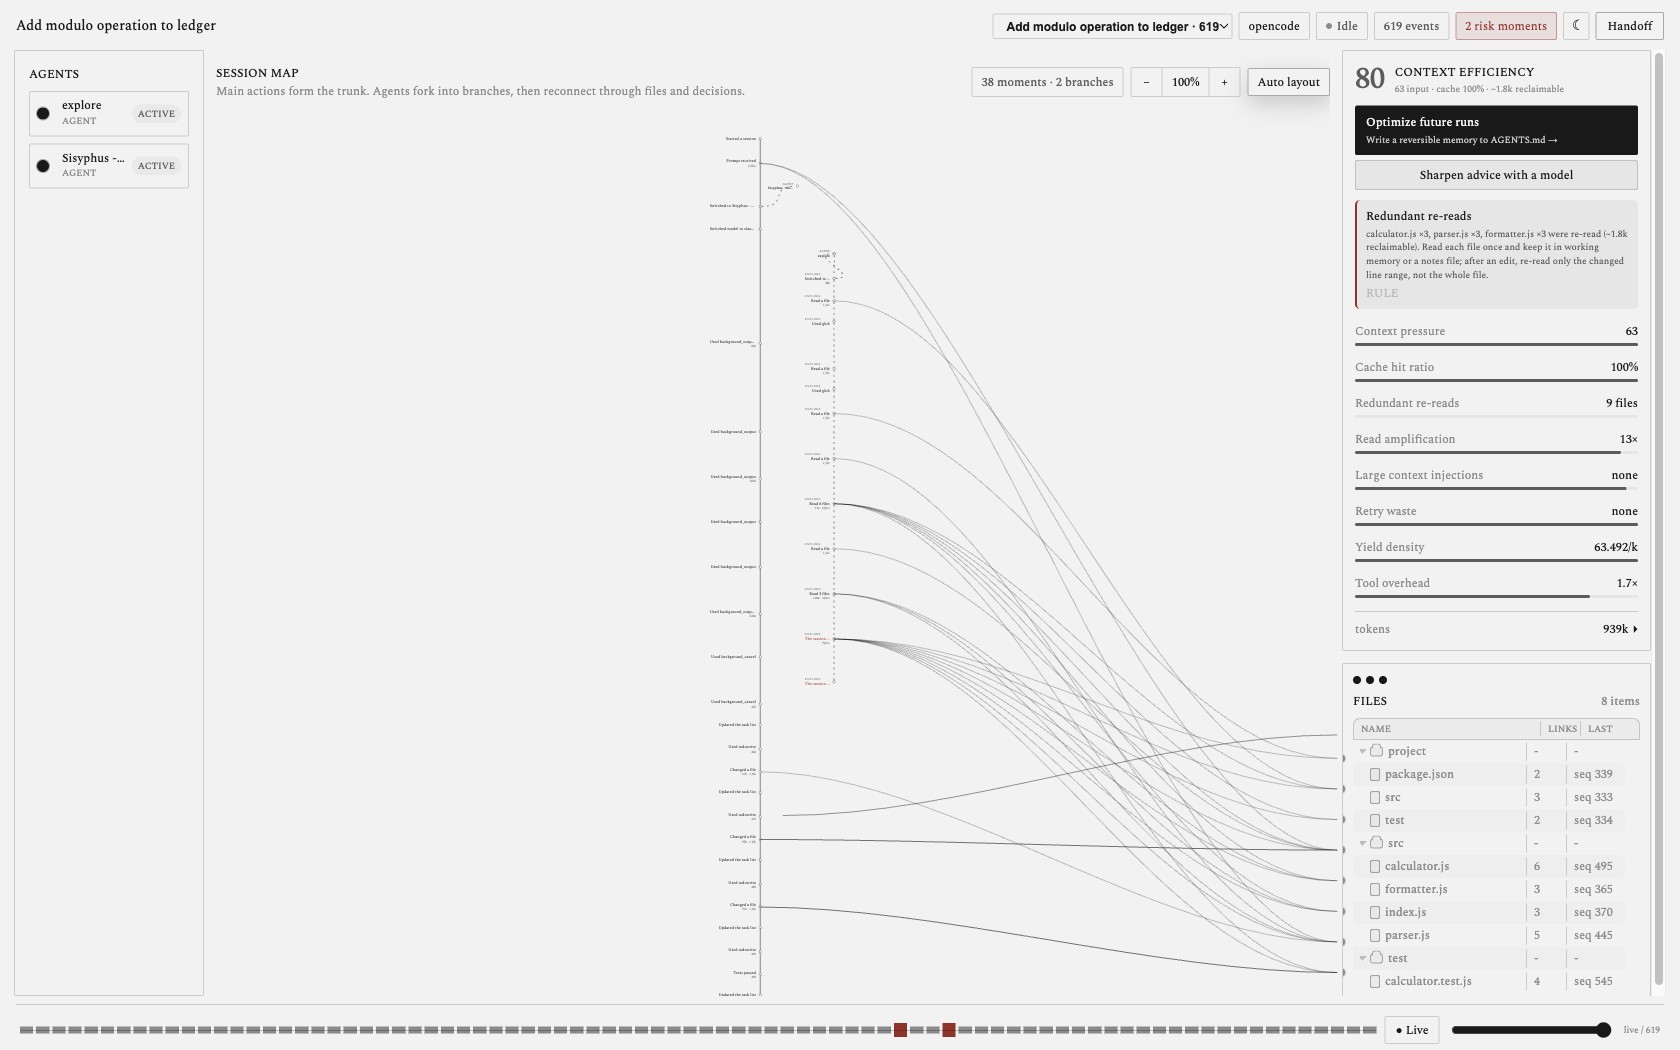
1 · See what the agent actually did. A coding agent reads a dozen files, runs commands, edits code, spawns subagents, and hands you back a tidy summary. Your only window into that is a scrolling transcript and a summary you take on faith. Agent-Blackbox replaces it with a structured, evidence-backed session map you read at a glance.
2 · See — and shrink — what it cost. Context is money, latency, and a hard window limit. Agent-Blackbox scores how economically each run used its context (cache reuse, redundant re-reads, read-vs-edit amplification, oversized tool dumps, retry waste) and surfaces specific optimizations — rule-based by default, or tailored by a free, local model with no API key.
| Reading the transcript | Agent-Blackbox | |---|---| | Scroll a linear log | A session map you read at a glance | | Trust the agent's summary | Reconstructed from observed events | | "It passed the tests" | See the fail → fix → pass loop | | Lose the thread on long runs | Scrub and replay any moment in time | | One opaque agent | Subagent genealogy — who delegated what | | No idea what it cost | A context-efficiency score + reclaimable tokens | | "Did it actually work?" | A second outcome score — efficient-but-failed ≠ wasteful-but-shipped | | One yardstick for every task | Task-tailored (research / debug / ops) + scored vs your own past runs | | "Why is this run so expensive?" | Concrete fixes, optionally written by a local model | | Re-read everything to resume | One-click handoff summary | | Your code & prompts leave the machine | Local-first, minimal capture, no API key |
Watch it happen — live
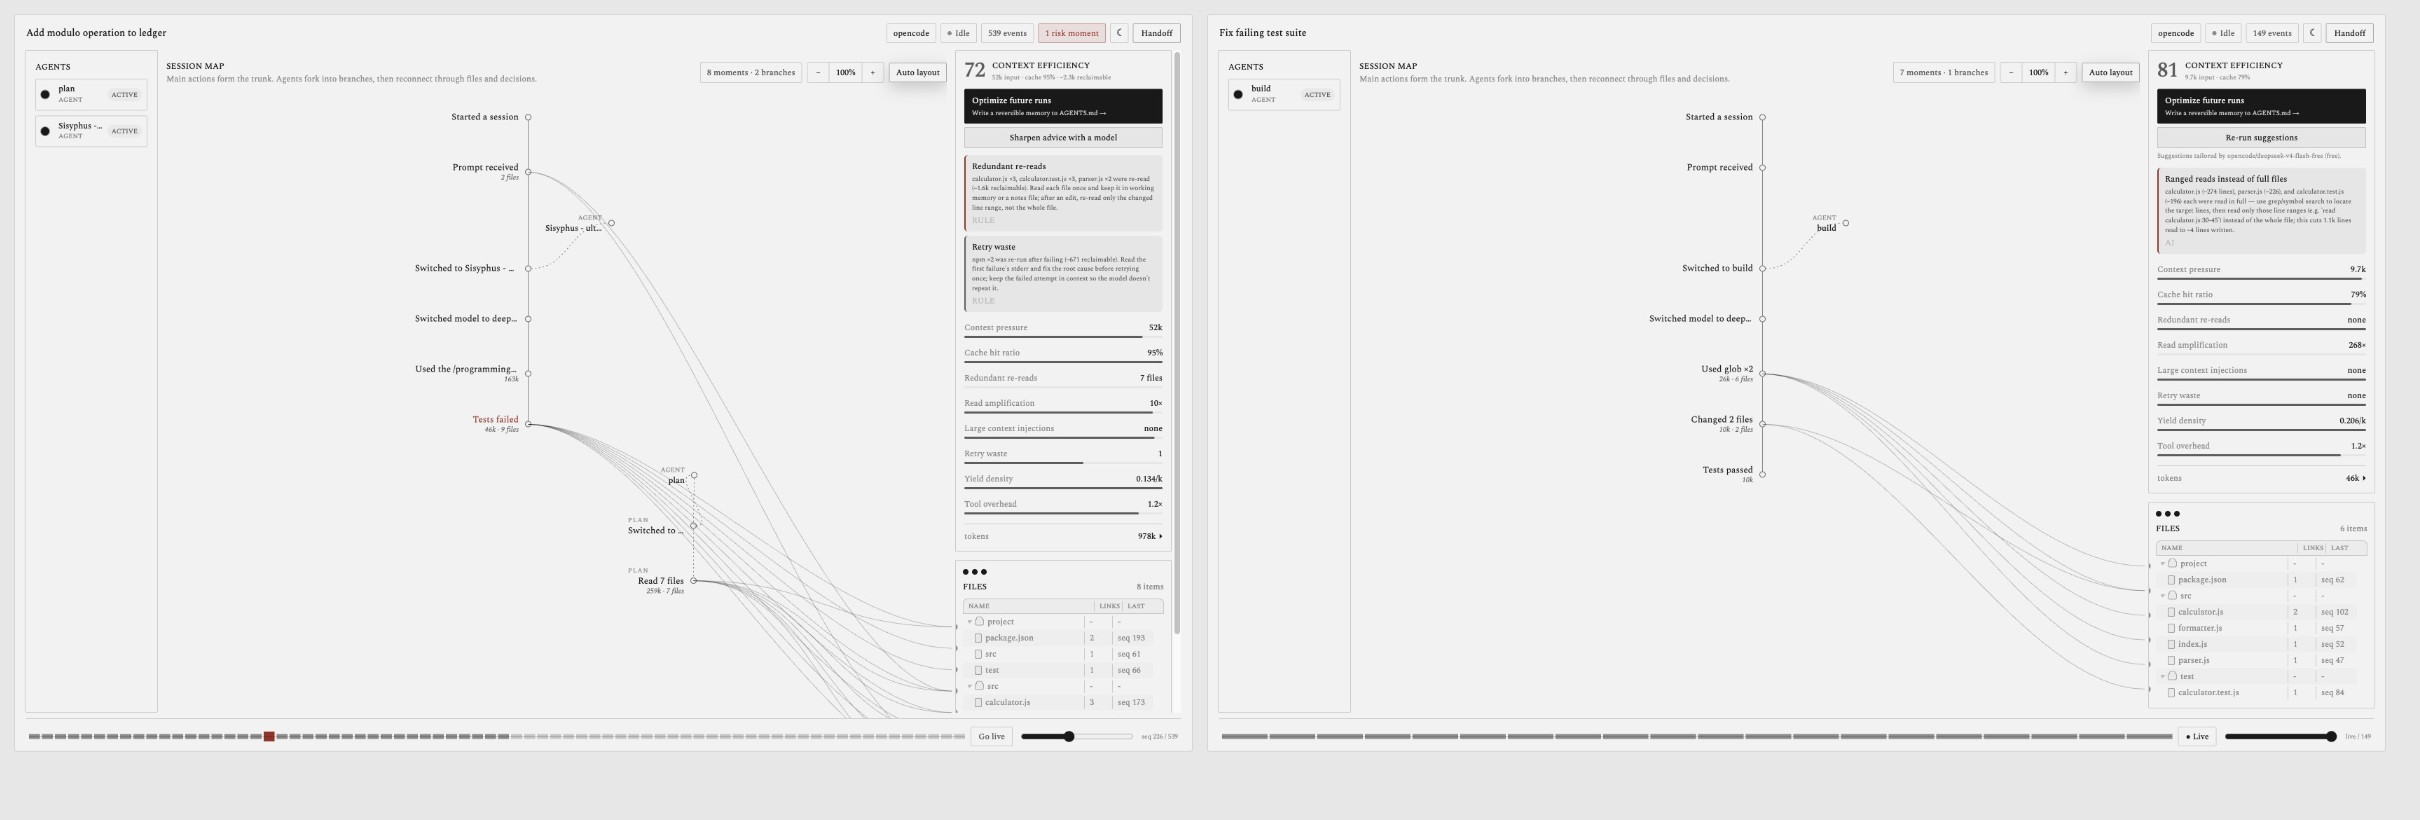
The map is not a post-mortem. It is built as the agent works: the recorder streams events to a local daemon, and the dashboard updates over a WebSocket — moments appear, files connect by sweeping arcs, tokens tick, a failed test marks oxblood, the fix resolves it. No refresh, no replay required.
That is the whole idea: open the black box while the flight is still in the air.
What you get
- Live session map — the run forms in real time as a spine of meaningful moments; consecutive repeats aggregate (
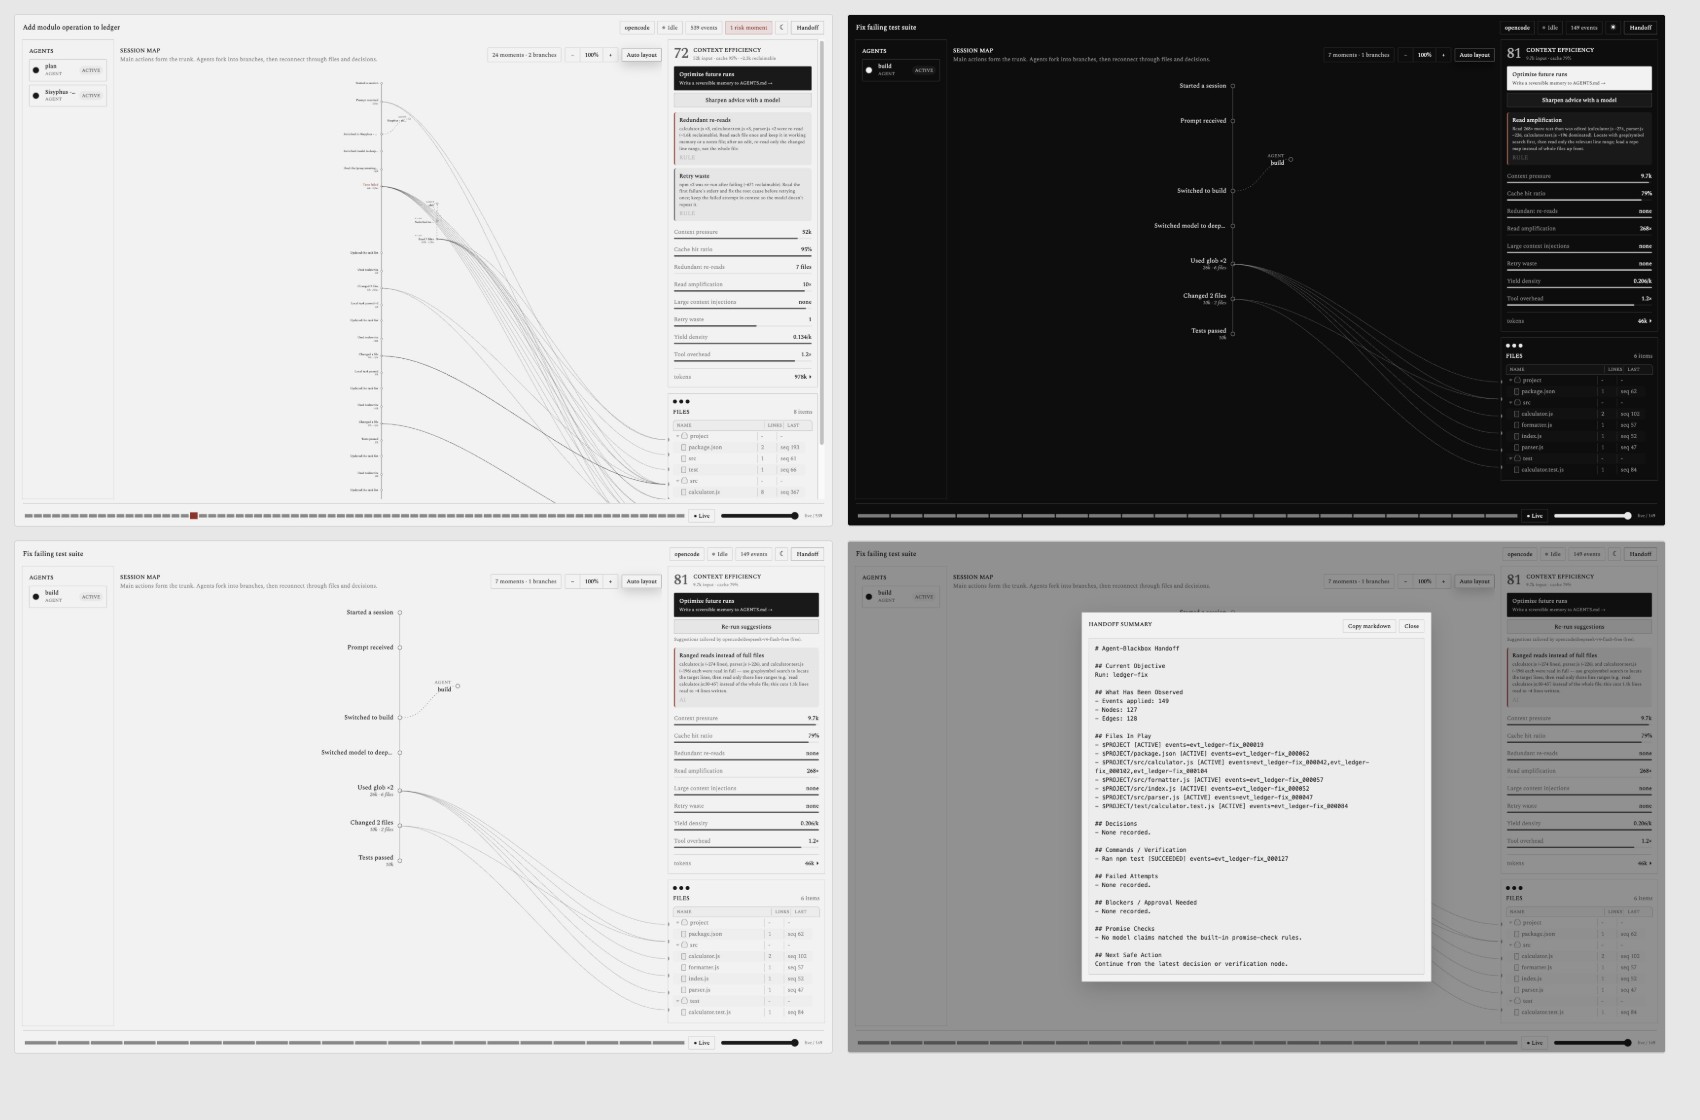
Created 12 files,Tests passed ×6) so even large runs stay scannable. - Narrative-structure aesthetic — a flat, monochrome "Mark Lombardi" diagram: hollow ring nodes, sweeping ring-to-ring arcs, serif labels. Graphite on paper (light) or silverpoint on ink (dark); the lone accent is oxblood, used only for risk/failure.
- Replay — drag the navigation-chart timeline to any sequence point; the graph and files reflect state at exactly that moment.
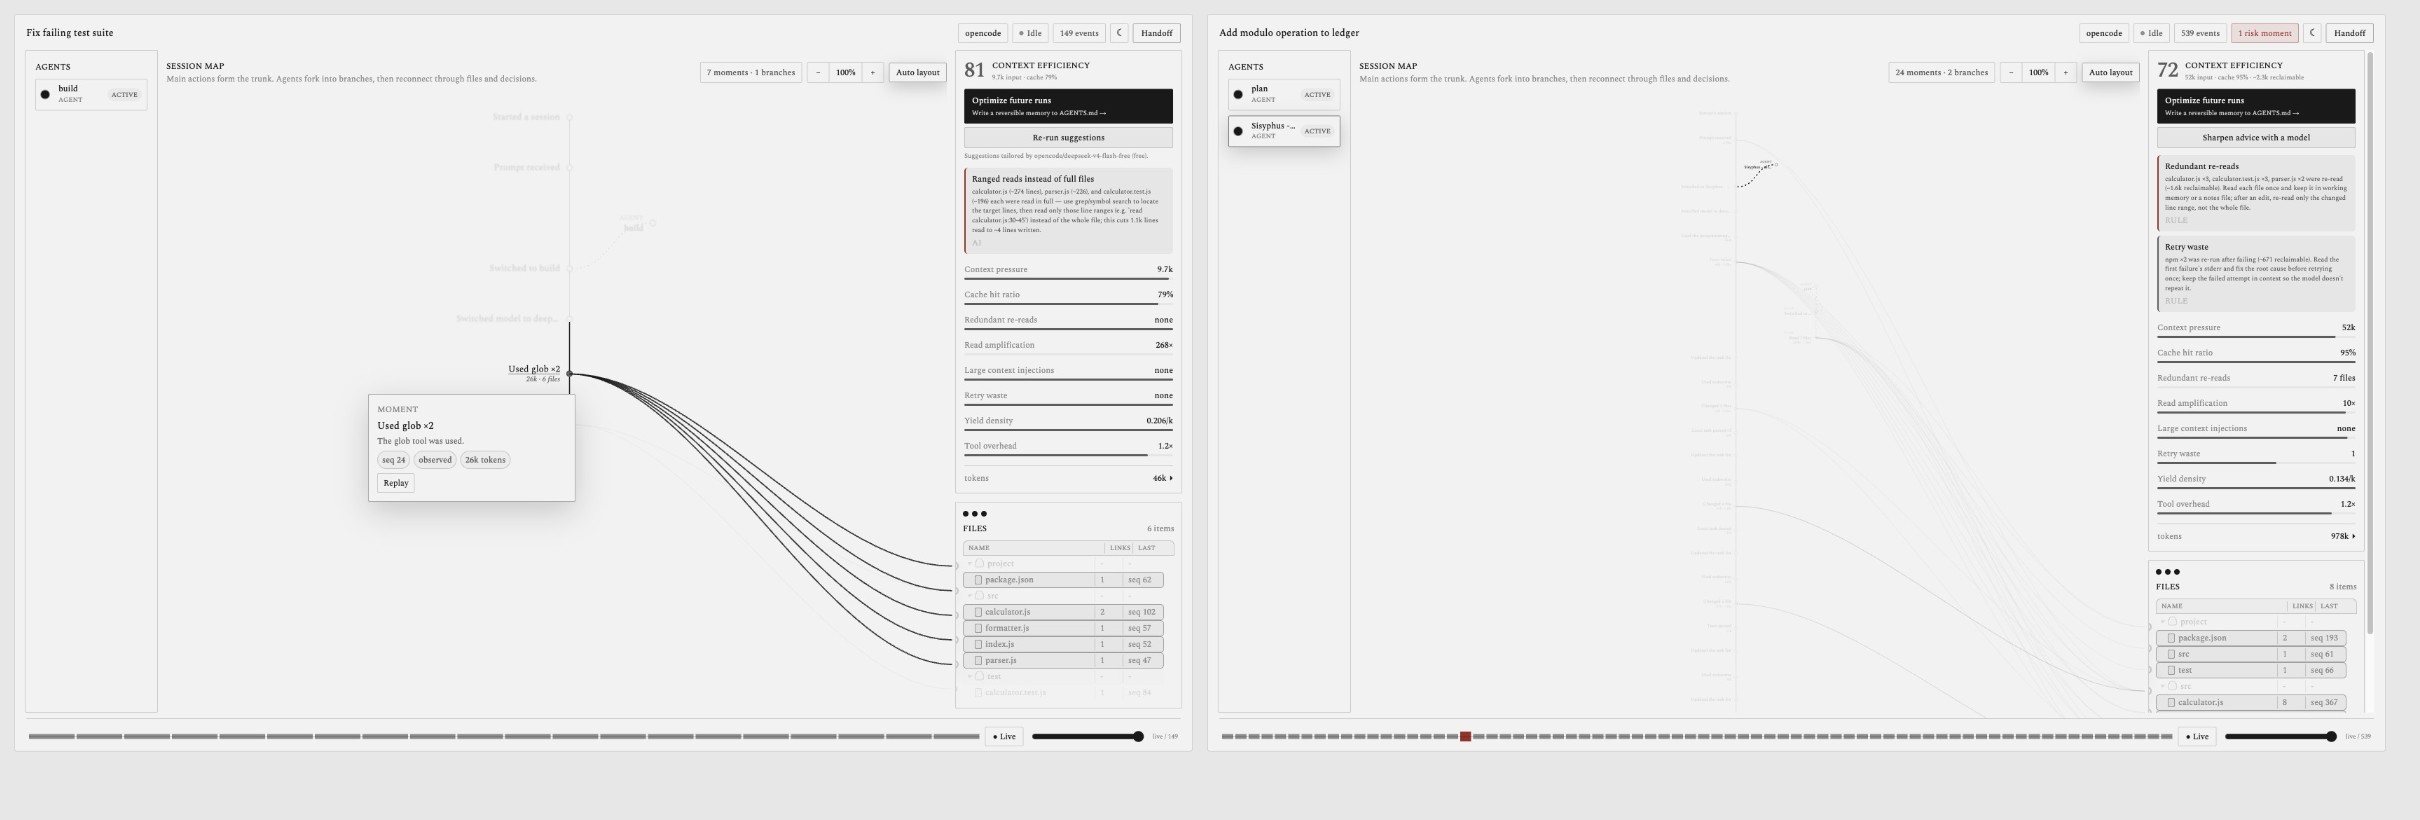
- Click to focus — select any moment for a detail popover (evidence, files, tokens); select an agent to isolate its lane; click a file to highlight every moment that touched it, with arcs drawn from each node's ring.
- Subagent genealogy — real delegations (the
tasktool / child sessions / workflow fan-out) fork into their own branch, attributed to the subagent that did the work. Each lane is named by role — its spawn type, or distilled from its task prompt ("You are a literature-search specialist…"→literature-search specialist) — so a run with dozens of parallel agents reads as roles, not paragraphs. A dense run opens at a readable zoom (the % button resets to fit the whole tree), and a finished run's lanes read DONE, not stuck on ACTIVE. - Map navigation — it's a pan-and-zoom canvas that adapts to your input. Trackpad: two-finger swipe pans, pinch zooms. Mouse: the wheel zooms (anchored under the cursor) and a middle-button (wheel) drag pans. Either way, drag empty space to rubber-band select nodes, click a node to focus it, and the toolbar's
−/%/+zoom (the % resets to fit the whole tree), Tracing follows the newest node live or pins the view, and Auto layout re-centers. - Context efficiency — a live score from 11 metrics (context pressure, cache hit, redundant reads, read amplification, large injections, retry waste, yield density, tool overhead, edit churn, large file reads, unused reads) with one-tap optimization notations — rule-based, or tailored by a free model with no API key.
--suggest freerotates a pool of free models across independent quotas (OpenCode Zen + Ollama cloud + local), failing over and cooling down on rate limits, so the AI suggestions stay free and durable over long sessions. - Task-tailored & multi-axis scoring — the score is judged on a yardstick that fits the task (a research run isn't dinged for reading widely; debug runs weigh retries/rework harder), shown as an archetype chip. A separate outcome score answers did the task land? (from edits, verification, failures) so an efficient-but-failed run reads differently from a wasteful-but-shipped one. And every run is scored against your own past runs of the same kind in the same project — "score 40 vs your usual 87 for research." (Full reference: docs/analysis.md.)
- Custom checks — drop a
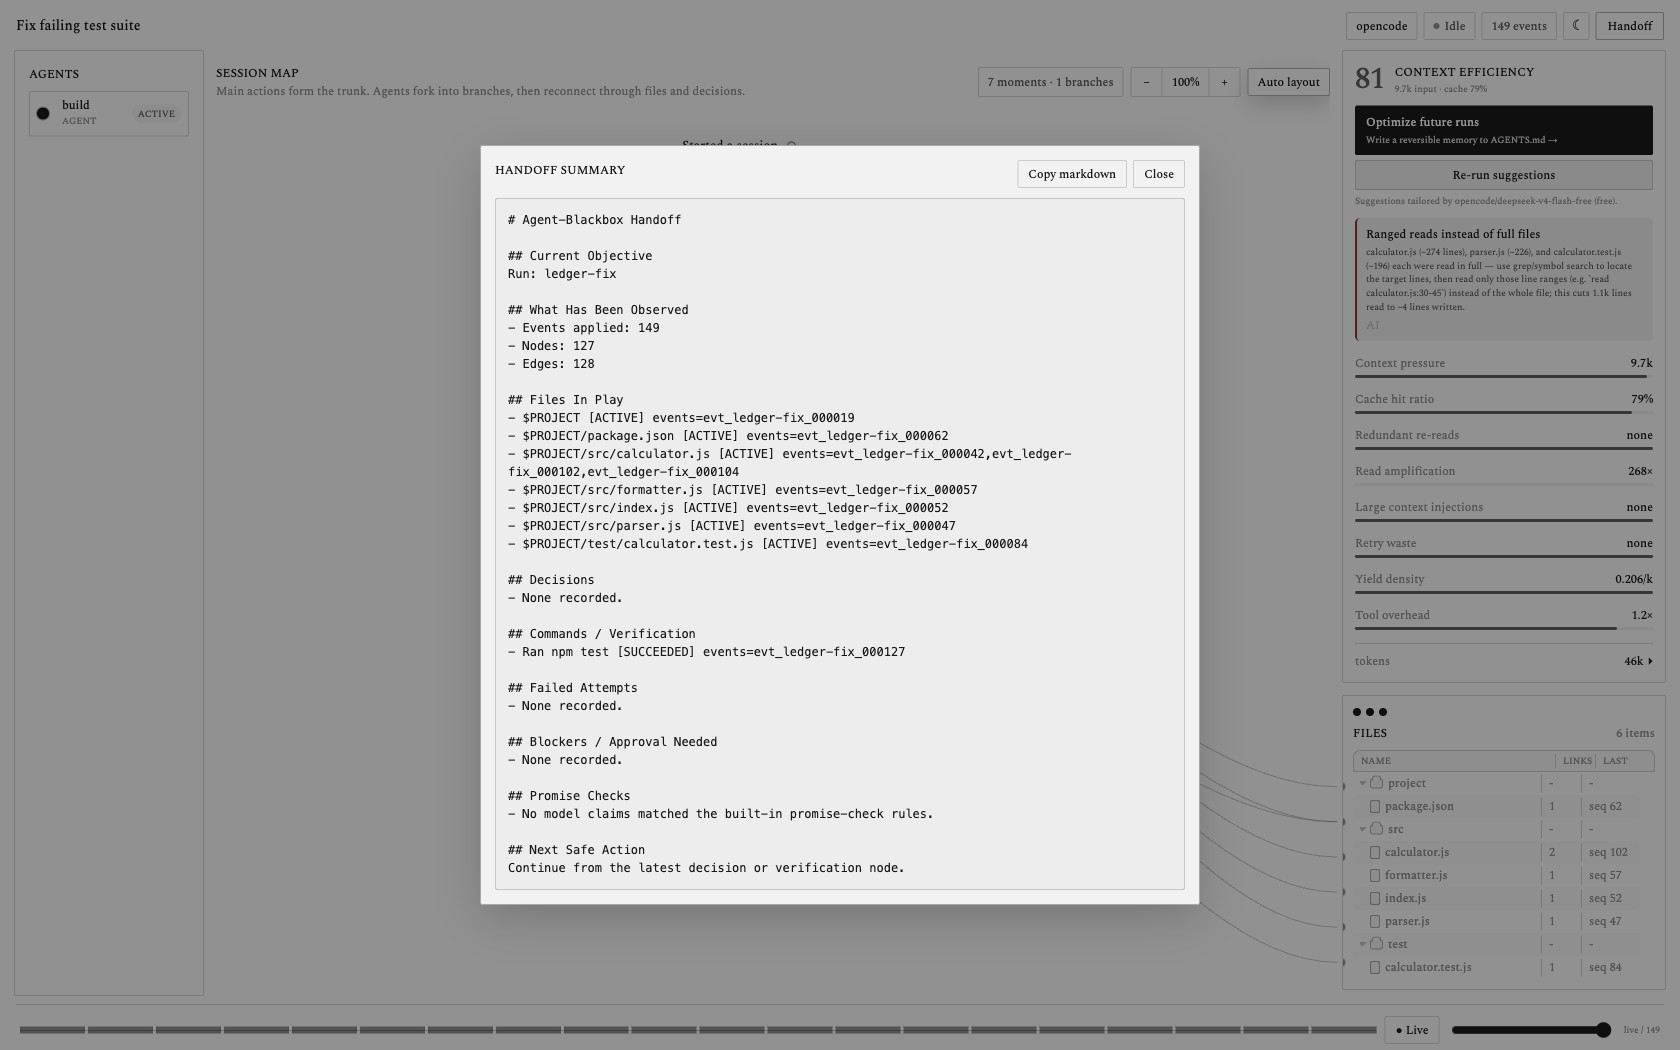
.agent-blackbox/rules.jsonto add project rules on top of the built-ins (e.g. never readnode_modules, run tests before committing); findings surface in the panel, separate from the score. - Handoff export — a structured continuation summary (objective, files in play, decisions, commands, failures, blockers, next safe action), one click to copy as Markdown.
- Run picker — one project log can hold many runs; the console follows the most recently active run and lets you pin any past one.
- Full event coverage — whichever model you run, every action is captured (reads, edits, bash, skills, custom/MCP tools, permissions, todos, subagents, slash commands,
/compactcontext compaction, agent/model switches) — keyed off the host event, never the model. Known noise (LSP, pty, file-watcher, MCP registry) is filtered; anything not yet modeled still surfaces as a labeled node, so nothing is silently dropped. - One-command bootstrap —
npm run upinstalls the recorder plugin, starts the daemon, and serves the dashboard.
Context efficiency — the part that pays for itself
Every run gets a score from observed sizes and token snapshots — never the agent's self-report. Each flagged metric expands into a concrete fix.
| Metric | What it catches | |---|---| | Context pressure | how large the prompt grew at its peak | | Cache hit ratio | how much of the prompt was served from cache | | Redundant re-reads | the same file pulled in more than once (with reclaimable tokens) | | Read amplification | reading far more than was edited — read the slice, not the file | | Large injections | a single tool output flooding the window | | Retry waste | failing commands re-run before the cause was fixed | | Yield density | how much concrete change each 1k tokens produced | | Tool overhead | tool calls relative to concrete outcomes | | Edit churn | one file rewritten many times (rework / unsettled approach) | | Large file reads | a single oversized file pulled in whole — read it in ranges | | Unused reads | read text never edited — push wide exploration into a sub-agent |
The score is task-tailored and multi-axis — a research run isn't judged on an edit run's yardstick, and "did it use context well" is kept separate from "did the task land":
- Task archetype (research / debug / ops / feature / edit) conditions the score so reading widely on a research run isn't penalised; shown as a chip, applied only once the classification is confident.
- Effectiveness — a second score (did the task actually land?) from outcome + verification + failure signals, with a confidence flag, so an efficient-but-failed run and a wasteful-but-shipped run read differently.
- Relative baselines — "score 40 vs your usual 87 for research", compared against your past runs of the same kind in the same project.
- Custom checks — drop a
.agent-blackbox/rules.jsonto add project rules (e.g. "never read node_modules", "run tests before committing").
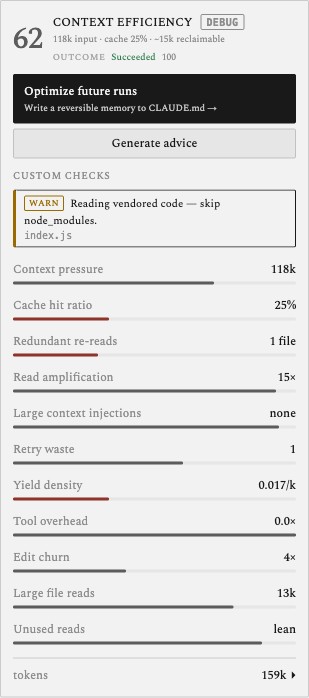
One run, both axes: efficient-but-wasteful (62) yet the task shipped (outcome 100) — plus a task-archetype chip, a project rule check, and the reversible-memory button.
Suggestions are rule-based by default (always on, no dependencies). To have them tailored by a model — with no API key — point up at a local/free model:
# Free, durable, default: rotate a pool of free models across independent quotas
npx @taewooopark/agent-blackbox up --suggest free
Ollama: local, no key
npx @taewooopark/agent-blackbox up --suggest ollama --suggest-model qwen2.5-coder
Any OpenAI-compatible localhost server (LM Studio, llama.cpp)
npx @taewooopark/agent-blackbox up --suggest openai-compat --suggest-base-url http://127.0.0.1:1234
Reuse OpenCode's free model via your installed binary
npx @taewooopark/agent-blackbox up --suggest opencode --suggest-model opencode/deepseek-v4-flash-free
--suggest free (and the default auto) rotate a curated pool of free models across independent quota pools — OpenCode Zen (opencode/*-free) + Ollama cloud + a local model — one model per call, rotated to spread load, failing over and cooling down a model that hits a rate limit (429) for 10 minutes, and falling back to rule-based only if every pool is exhausted. So the AI suggestions stay free and keep working over long sessions without you babysitting a single quota. Only a redacted, derived digest is ever sent, even to a local model: metric statuses, counts, and sizes, plus coarse offender labels — file basenames and command verbs (e.g. billing.ts ×2, deploy ×2) so the advice can name what to fix — but never file contents, directory paths, command arguments, prompts, or secrets.
What the advice is built on
The suggestions aren't generic tips. Both the always-on rule-based floor and the local-model prompt encode a per-metric fix playbook, and every action is required to cite the run's own numbers, name the offending file/command, state a concrete mechanism, and give the expected effect. The playbook is distilled from published context-engineering research and production practice:
| Source | What it contributes | Metrics it informs | |---|---|---| | Anthropic — Effective context engineering for AI agents | Compaction (summarize resolved turns → fresh window), clearing tool outputs already acted on, sub-agent context isolation (explore in a child that returns a ~1–2k-token summary), and just-in-time retrieval (grep/glob, read on demand instead of pre-loading whole files) | context-pressure, read-amplification, redundant-reads, yield-density | | Manus — Context Engineering for AI Agents: Lessons from Building Manus | KV-cache hit rate as the primary cost lever (cached tokens ≈ 10× cheaper), a byte-stable prompt prefix (no timestamps/volatile data), append-only context, masking tools instead of adding/removing them, the file system as external memory, and recitation of the goal each step | cache-hit, large-injections, retry-waste | | Liu et al. — Lost in the Middle: How Language Models Use Long Contexts | Models systematically under-use the middle of long contexts (U-shaped accuracy, ~30%+ degradation) — so advice favors trimming/repositioning and goal recitation over "add more context" | context-pressure, yield-density | | Anthropic — Building effective agents | Minimal, non-overlapping tool sets and unambiguous tool boundaries; batch related actions instead of exploratory call chains | tool-overhead | | Schulhoff et al. — The Prompt Report: A Systematic Survey of Prompt Engineering Techniques | Contrastive few-shot exemplars (a bad-vague vs good-specific pair), grounding answers in the provided numbers, and strict structured output — so even small local models return specific, actionable JSON | (shapes the advisor prompt itself) |
Verified end-to-end on a small local model: a redundant-reads finding turns from "read each file once" into "calculator.js was read 2× (~282 reclaimable) — read it once and cache it, then after each edit re-read only the changed line range instead of the whole file."
Close the loop — write the fix back (experimental)
Advice you have to re-apply by hand is friction. optimize turns your findings into a small, cache-safe memory block in the file the agent already reads as context — CLAUDE.md for Claude Code, AGENTS.md for OpenCode — so the next run avoids the waste before it happens. It accumulates across runs: a pattern seen repeatedly ranks first (annotated ×N) and one-offs fade, so the block reflects your project's real habits, not just the last run. It's the actuator half of the recorder: observe → diagnose → write → measure → roll back if it didn't help.
# Preview what it would write (no changes)
npm run optimize -- --project ~/code/my-app
Apply: append a managed block to CLAUDE.md / AGENTS.md + record the baseline score
npm run optimize -- --project ~/code/my-app --apply
After the next run, confirm it helped — auto-rolls-back on a clear score drop
npm run optimize -- --project ~/code/my-app --check
Undo at any time
npm run optimize -- --project ~/code/my-app --revert
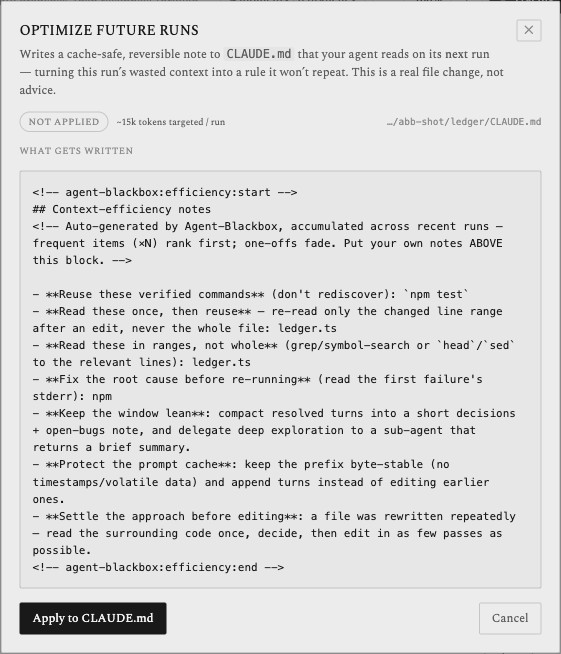
The block is written between markers at the end of the file, so the stable prompt-cache prefix is never disturbed. It names the concrete offenders (files to read once, large outputs to scope, verified build/test commands to reuse) and is fully reversible — every write is marked, opt-in, and never silent.
Prefer the dashboard? The Optimize future runs button in the right rail opens a popup that previews the exact block before anything is written — with the reclaimable-token target and the target path — then applies, updates, or reverts it in one click. A real, reversible file change, not advice:
Measured on a real run
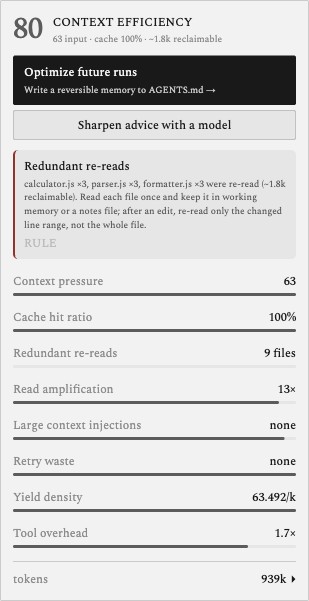
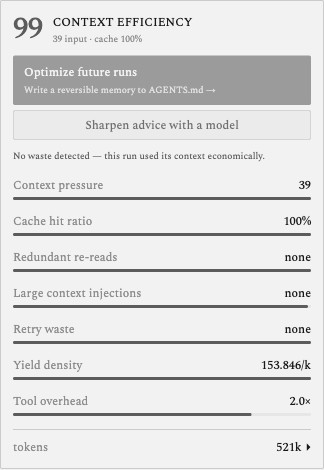
A fair before/after on a real oh-my-openagent ultrawork run (Claude Sonnet driving the whole multi-agent team; same task — "add a modulo operation end-to-end"). Run A's explore subagents re-read 9 files; Agent-Blackbox flagged it and pinned "read calculator.js, parser.js, formatter.js once" to AGENTS.md. Run B — same task, same model, fresh cold session, only the memory added — read each once:
| | Before (run A) | After (run B) | |---|---|---| | Context-efficiency score | 80 | 99 | | Redundant re-reads | 9 files (~1.8k reclaimable) | none | | Total tokens | 939k | 521k (−44%) | | Tool calls / events | 619 | 253 | | Yield density | 63/k | 154/k |
Both runs started from the identical pristine repo (git-reset between them) and a brand-new OpenCode session — no carried context. The redundant-reads elimination (9 files → none) is the memory working directly; OMO is stochastic, so part of the token/event drop is run-to-run variance, but the lever ABB pinned is exactly the waste that disappeared.
 |
 |
⚠️ This --check two-run cycle is a benchmark to validate the mechanism — not the production workflow. Re-running the same task to measure would spend tokens twice. In real use you apply once and the memory pays off on future, different tasks in that repo (reused commands, files to read once) with no extra run.
In-run optimizer — cut the waste live, no re-run (opt-in)
The cross-run memory above pays off on future tasks. The in-run optimizer cuts waste inside the current run — the recorder stops being purely passive and serves re-reads cheaply through the OpenCode tool hooks. Enable it with AGENTBLACKBOXOPTIMIZE=1 (or --optimize at install); off by default.
- Re-reads served as a no-op or a diff. When the agent re-reads a file it already read this run, the
tool.execute.afterhook rewrites the result: unchanged → a one-line "reuse your earlier copy" note; edited → only the changed line range. Measured on a 120-line file: 96% fewer tokens on an unchanged re-read, 94% on an edited one — in the same run, zero re-run. - Correct by construction. Re-reads are never blocked (you might genuinely need one). The no-op/diff only fires when no compaction has happened since the file was last served — so the content is provably still in context. After a compaction the full file is served again, because the agent may have lost it.
- Working-set memory injected live. Via
experimental.chat.system.transform, a tiny always-current block (hot files + verified commands, derived from observed events) is appended to the system prompt, so the agent recalls instead of re-reading.
What's next
- Longitudinal trend — Agent-Blackbox records every run; chart the efficiency score across your real runs and show whether it rises after the memory + optimizer land — measurement from actual work, not a benchmark.
- Diff-serving across compaction — keep a small local content cache so even post-compaction re-reads can be served as diffs (today they fall back to full).
Pairs with oh-my-openagent — profile and shrink heavy multi-agent runs
oh-my-openagent (OMO) turns OpenCode into a multi-agent tokenmaxxer harness — 11 specialists, parallel execution, a relentless loop that spends tokens hard to ship complex work. Agent-Blackbox is the instrument built for exactly that workload: OMO floors the accelerator; Agent-Blackbox is the dyno and the telemetry.
They're both OpenCode plugins and coexist with zero config — run OMO with the recorder installed and the whole team shows up:
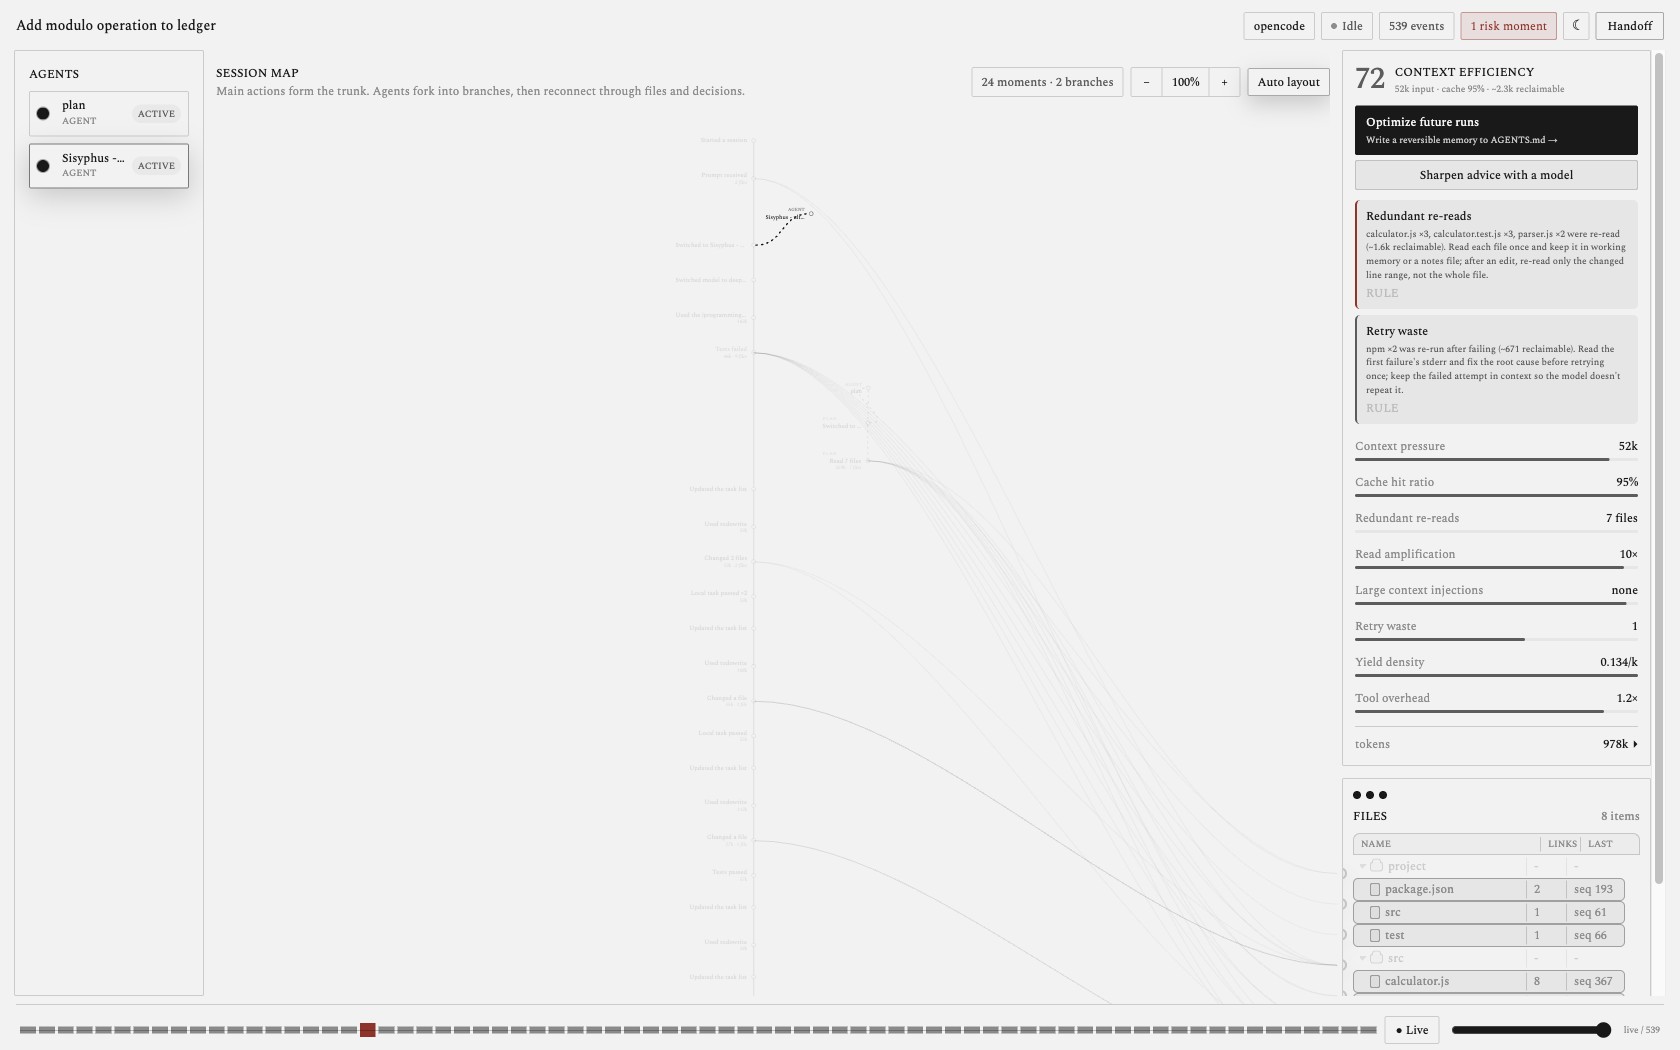
- See the whole team. Every SDK-spawned subagent (Sisyphus, explore, librarian, plan, oracle…) gets its own lane; delegation forks the trunk; files connect by sweeping arcs. The map was built for runs this complex.
- See — and shrink — the cost. A "tokenmaxxer" run is exactly where context economy matters most. Agent-Blackbox scores it (context pressure, redundant re-reads, read amplification, tool overhead) and names the precise offenders — the cost you can't see from inside the harness.
- Close the loop. Pin the findings to
AGENTS.mdfor the next run, and turn on the in-run optimizer (AGENTBLACKBOXOPTIMIZE=1) to serve a re-read as a no-op/diff — savings inside the same run, no re-run.
ultrawork run, recorded live by Agent-Blackbox — named specialist lanes on the left, and a context-efficiency score with reclaimable tokens and tailored fixes on the right:
# Both install globally — start ABB once, then run OMO however you like. Watch :5173.
npx @taewooopark/agent-blackbox up --suggest free
opencode "ultrawork: refactor the auth module and add tests"   # OMO + recorder both active
Handoff — pick the run up anywhere
When you need to continue the run elsewhere — a teammate, the next agent, or the same agent after a context reset — export a structured handoff:
How it works
Claude Code transcripts (tailed) ─┐
 OpenCode hooks → recorder plugin ─┴─▶ host adapter ─▶ daemon ─▶ dashboard
                                       redact+normalize  NDJSON    live session map
+ graph + efficiencypackages/core— canonicalTraceEvents, the workflow graph model, redaction, replay, audit, handoff generation, and the context-efficiency engine.packages/claude-code-adapter— tails the JSONL transcripts Claude Code writes (~/.claude/projects/) and normalizes them into canonical, redacted events — no plugin, no install. Optional hooks add the in-run actuator.packages/opencode-adapter— a thin OpenCode plugin that turns host events and tool calls into canonical, redacted events (with content sizes, never content) and ships them to the daemon, best-effort with retries.apps/daemon— ingests events to a local NDJSON log, materializes the graph, replays it to any point, computes the efficiency report, routes suggestions, and pushes live snapshots over WebSocket.apps/dashboard— the operator console: live session map, replay, inspector, efficiency co-pilot, and handoff.
Philosophy — observe, don't trust the narrator
Derive the truth from observed events, never from free-form self-report.
- Behavior, not narration. Every node is an event the agent actually emitted — a read, an edit, a command and its exit code, a delegation — not a sentence it wrote about itself.
- Cost is evidence too. The efficiency score and every suggestion come from observed sizes and token snapshots, not from the model's account of its own thrift.
- Local-first, no key. Traces stay on your machine. Raw prompts, secrets, and file contents are redacted by default; even the optional model suggestions run locally and receive only a redacted digest.
- Host-agnostic core. A canonical event + graph core with thin host adapters, so the same black box can sit behind any agent harness — Claude Code and OpenCode are the first two.
Daemon API
| Method & path | Purpose | |---|---| | POST /events | Ingest a canonical TraceEvent | | GET /events | The durable event log | | GET /graph?seq=<n> | Replay the graph up to a sequence | | GET /snapshot?seq=<n> | Events, graph, audit checks, efficiency + effectiveness reports, baselines, rule packs, and handoff markdown | | GET /audit | Promise / claim checks | | GET /efficiency?seq=<n> | Context-efficiency report (scores + metrics + archetype) | | POST /suggest | Optimization suggestions for a posted report + optional causal timeline (deterministic or local-model) | | GET·POST /optimize[/apply\|/revert]?runId=<id> | Preview / apply / revert the memory block for a run (reversible file write) | | GET /handoff | Generated handoff markdown | | WS /stream | Live snapshots pushed after each ingest |
Project layout
apps/
  daemon/             local ingest, replay, efficiency, suggestion routing, static dashboard, websocket
  dashboard/          operator console (session map, replay, inspector, efficiency, handoff)
packages/
  core/                 canonical events, graph, redaction, replay, audit, handoff, efficiency,
                        archetypes, effectiveness, baselines, accumulative memory, timeline, rule packs
  storage/              NDJSON persistence
  claude-code-adapter/  Claude Code transcript tailer + in-run actuator hooks
  opencode-adapter/     OpenCode plugin / SDK bridge
Per-project state the daemon writes (all local, best-effort, reversible) lives under <project>/.agent-blackbox/: optimization.json + efficiency-profile.json (the accumulated memory), and you can add rules.json (custom checks). Cross-run baselines live next to the daemon's event store as baselines.json. See docs/analysis.md.
Development
npm install
npm run check   # typecheck + tests
npm run build
Roadmap
- More host adapters (Codex, PI, and other harnesses) on the same canonical core — Claude Code and OpenCode ship today.
- Shipped recently: a second outcome axis, task-archetype scoring, per-project baselines ("vs your usual run"), accumulative optimize memory, and custom rule packs — see docs/analysis.md.
- Fleet-wide efficiency-trend charts across many runs (the per-run baseline data already lands locally; the longitudinal view is next).
- Deeper audit: richer claim-vs-evidence verification and risky-command surfacing.
Contact


Local-first. No API key. Observe, don't trust the narrator.


