
Spring Boot microservices app with Spring Cloud, Robust and resilient backend managing e-Commerce app
e-Commerce-boot μServices
Important Note: This project's new milestone is to move The whole system to work on Kubernetes, so stay tuned.
Introduction
- This project is a development of a small set of Spring Boot and Cloud based Microservices projects that implement cloud-native intuitive, Reactive Programming, Event-driven, Microservices design patterns, and coding best practices.
- The project follows CloudNative recommendations and The twelve-factor app methodology for building software-as-a-service apps to show how μServices should be developed and deployed.
- This project uses cutting edge technologies like Docker, Kubernetes, Elasticsearch Stack for
Getting started
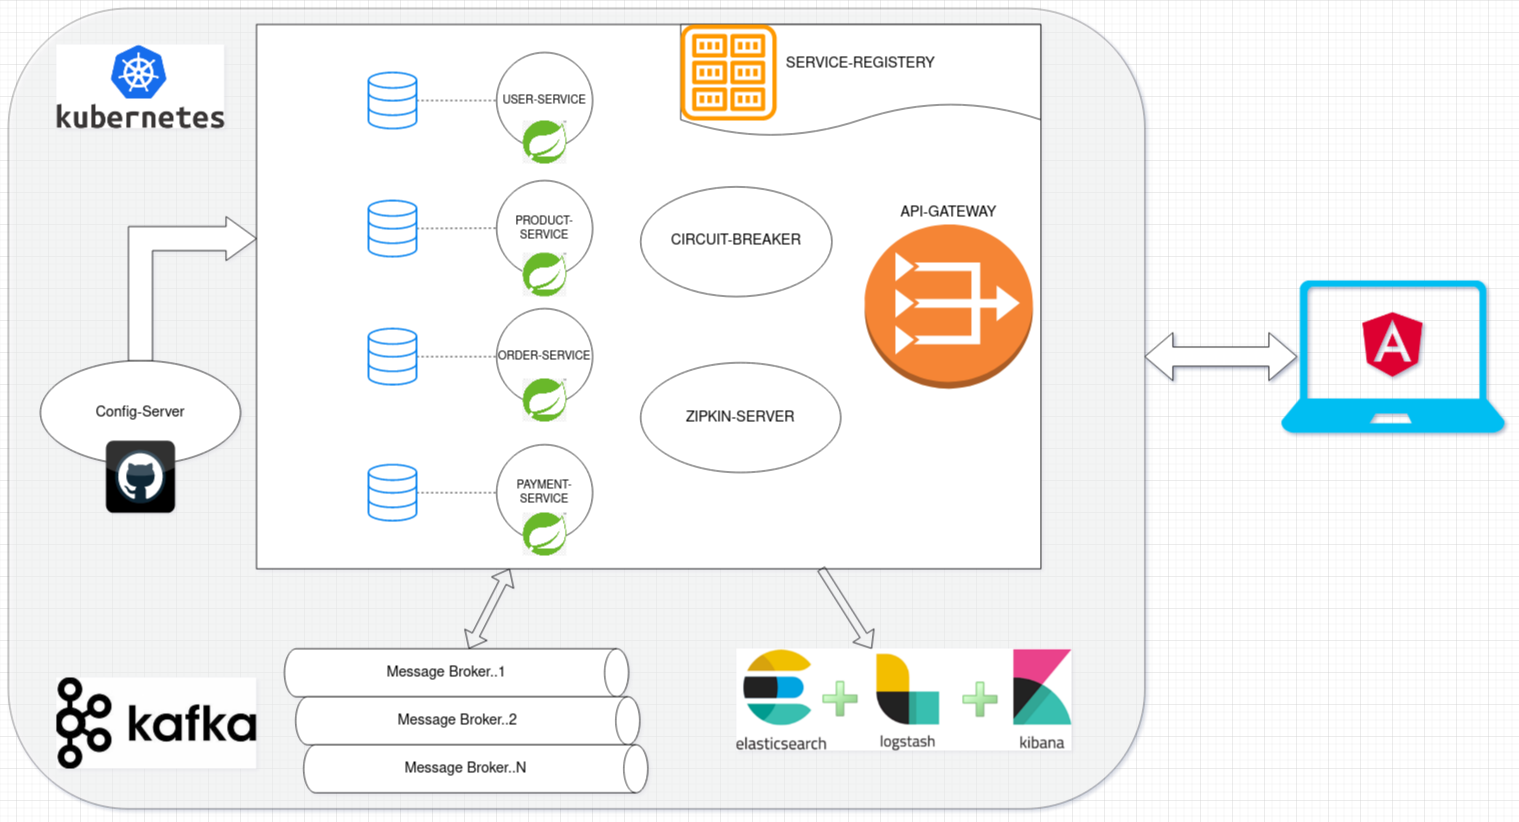
System components Structure
Let's explain first the system structure to understand its components:ecommerce-microservice-backend-app [μService] --> Parent folder. |- docs --> All docs and diagrams. |- k8s --> All Kubernetes config files. |- proxy-client --> Authentication & Authorization µService, exposing all |- api-gateway --> API Gateway server |- service-discovery --> Service Registery server |- cloud-config --> Centralized Configuration server |- user-service --> Manage app users (customers & admins) as well as their credentials |- product-service --> Manage app products and their respective categories |- favourite-service --> Manage app users' favourite products added to their own favourite list |- order-service --> Manage app orders based on carts |- shipping-service --> Manage app order-shipping products |- payment-service --> Manage app order payments |- compose.yml --> contains all services landscape with Kafka |- run-em-all.sh --> Run all microservices in separate mode. |- setup.sh --> Install all shared POMs and shared libraries. |- stop-em-all.sh --> Stop all services runs in standalone mode. |- test-em-all.sh --> This will start all docker compose landscape and test them, then shutdown docker compose containers with test finishes (use switch start stop)System Boundary Architecture - μServices Landscape
Required software
The following are the initially required software pieces:
- Java 11: JDK 11 LTS can be downloaded and installed from https://www.oracle.com/java/technologies/javase/jdk11-archive-downloads.html
- Git: it can be downloaded and installed from https://git-scm.com/downloads
- Maven: Apache Maven is a software project management and comprehension tool, it can be downloaded from here https://maven.apache.org/download.cgi
- curl: this command-line tool for testing HTTP-based APIs can be downloaded and installed from https://curl.haxx.se/download.html
- jq: This command-line JSON processor can be downloaded and installed from https://stedolan.github.io/jq/download/
- Spring Boot Initializer: This Initializer generates spring boot project with just what you need to start quickly! Start from here https://start.spring.io/
- Docker: The fastest way to containerize applications on your desktop, and you can download it from here https://www.docker.com/products/docker-desktop
- Kubernetes: We can install minikube for testing puposes https://minikube.sigs.k8s.io/docs/start/
Follow the installation guide for each software website link and check your software versions from the command line to verify that they are all installed correctly.
Using an IDE
I recommend that you work with your Java code using an IDE that supports the development of Spring Boot applications such as Spring Tool Suite or IntelliJ IDEA Ultimate Edition. So you can use the Spring Boot Dashboard to run the services, run each microservice test case, and many more.
All that you want to do is just fire up your IDE -> open or import the parent folder ecommerce-microservice-backend-app, and everything will be ready for you.
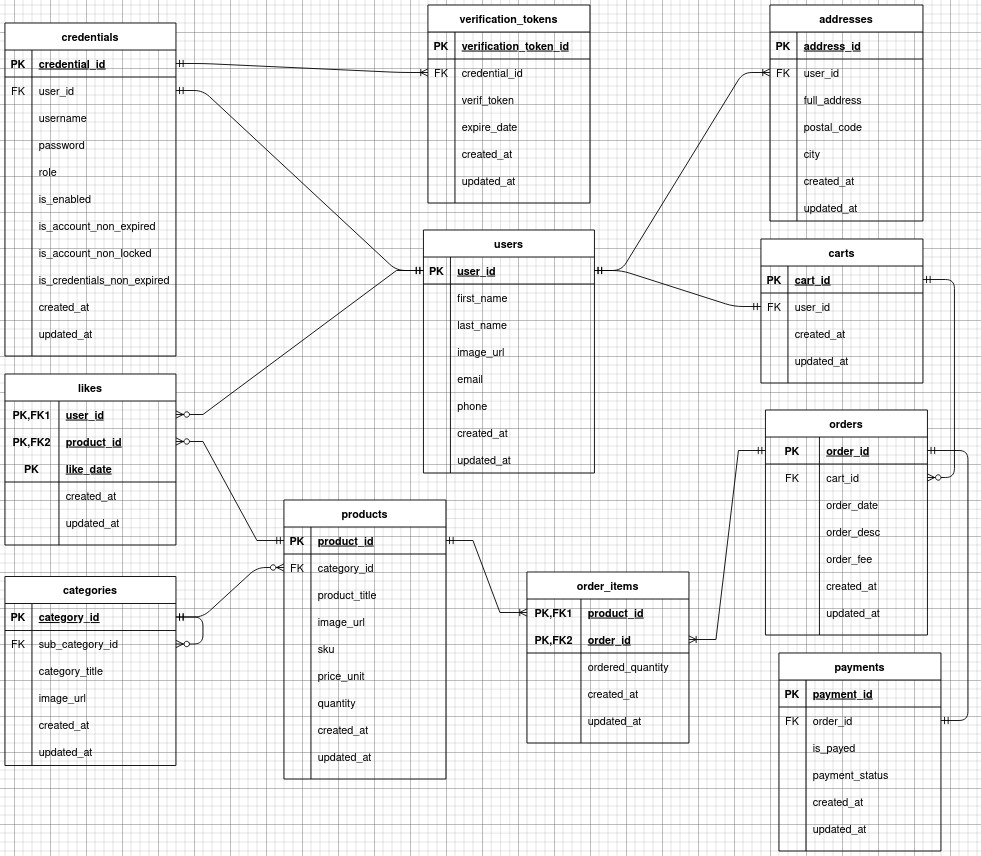
Data Model
Entity-Relationship-Diagram
Playing With e-Commerce-boot Project
Cloning It
The first thing to do is to open git bash command line, and then simply you can clone the project under any of your favorite places as the following:
> git clone https://github.com/SelimHorri/ecommerce-microservice-backend-app.gitBuild & Test Them In Isolation
To build and run the test cases for each service & shared modules in the project, we need to do the following:
Build & Test µServices
Now it is the time to build our 10 microservices and run each service integration test in isolation by running the following commands:selim@:~/ecommerce-microservice-backend-app$ ./mvnw clean packageAll build commands and test suite for each microservice should run successfully, and the final output should be like this:
---------------< com.selimhorri.app:ecommerce-microservice-backend >-----------
[INFO] ------------------------------------------------------------------------
[INFO] Reactor Summary for ecommerce-microservice-backend 0.1.0:
[INFO]
[INFO] ecommerce-microservice-backend ..................... SUCCESS [  0.548 s]
[INFO] service-discovery .................................. SUCCESS [  3.126 s]
[INFO] cloud-config ....................................... SUCCESS [  1.595 s]
[INFO] api-gateway ........................................ SUCCESS [  1.697 s]
[INFO] proxy-client ....................................... SUCCESS [  3.632 s]
[INFO] user-service ....................................... SUCCESS [  2.546 s]
[INFO] product-service .................................... SUCCESS [  2.214 s]
[INFO] favourite-service .................................. SUCCESS [  2.072 s]
[INFO] order-service ...................................... SUCCESS [  2.241 s]
[INFO] shipping-service ................................... SUCCESS [  2.197 s]
[INFO] payment-service .................................... SUCCESS [  2.006 s]
[INFO] ------------------------------------------------------------------------
[INFO] BUILD SUCCESS
[INFO] ------------------------------------------------------------------------
[INFO] Total time:  24.156 s
[INFO] Finished at: 2021-12-29T19:52:57+01:00
[INFO] ------------------------------------------------------------------------
Running Them All
Now it's the time to run all of our Microservices, and it's straightforward just run the followingdocker-compose commands:
selim@:~/ecommerce-microservice-backend-app$ docker-compose -f compose.yml upAll the services, databases, and messaging service will run in parallel in detach mode (option -d), and command output will print to the console the following:
Creating network "ecommerce-microservice-backend-app_default" with the default driver
Creating ecommerce-microservice-backend-appapi-gateway-container1       ... done
Creating ecommerce-microservice-backend-appfavourite-service-container1 ... done
Creating ecommerce-microservice-backend-appservice-discovery-container1 ... done
Creating ecommerce-microservice-backend-appshipping-service-container1  ... done
Creating ecommerce-microservice-backend-apporder-service-container1     ... done
Creating ecommerce-microservice-backend-appuser-service-container1      ... done
Creating ecommerce-microservice-backend-apppayment-service-container1   ... done
Creating ecommerce-microservice-backend-appproduct-service-container1   ... done
Creating ecommerce-microservice-backend-appproxy-client-container1      ... done
Creating ecommerce-microservice-backend-appzipkin-container1            ... done
Creating ecommerce-microservice-backend-appcloud-config-container1      ... done
Access proxy-client APIs
You can manually testproxy-client APIs throughout its Swagger interface at the following
URL https://localhost:8900/swagger-ui.html.
Access Service Discovery Server (Eureka)
If you would like to access the Eureka service discovery point to this URL http://localhosts:8761/eureka to see all the services registered inside it.Access user-service APIs
URL https://localhost:8700/swagger-ui.html.The API Gateway and Store Service both act as a resource server.
Check all Spring Boot Actuator exposed metrics http://localhost:8080/app/actuator/metrics:
{
    "names": [
        "http.server.requests",
        "jvm.buffer.count",
        "jvm.buffer.memory.used",
        "jvm.buffer.total.capacity",
        "jvm.classes.loaded",
        "jvm.classes.unloaded",
        "jvm.gc.live.data.size",
        "jvm.gc.max.data.size",
        "jvm.gc.memory.allocated",
        "jvm.gc.memory.promoted",
        "jvm.gc.pause",
        "jvm.memory.committed",
        "jvm.memory.max",
        "jvm.memory.used",
        "jvm.threads.daemon",
        "jvm.threads.live",
        "jvm.threads.peak",
        "jvm.threads.states",
        "logback.events",
        "process.cpu.usage",
        "process.files.max",
        "process.files.open",
        "process.start.time",
        "process.uptime",
        "resilience4j.circuitbreaker.buffered.calls",
        "resilience4j.circuitbreaker.calls",
        "resilience4j.circuitbreaker.failure.rate",
        "resilience4j.circuitbreaker.not.permitted.calls",
        "resilience4j.circuitbreaker.slow.call.rate",
        "resilience4j.circuitbreaker.slow.calls",
        "resilience4j.circuitbreaker.state",
        "system.cpu.count",
        "system.cpu.usage",
        "system.load.average.1m",
        "tomcat.sessions.active.current",
        "tomcat.sessions.active.max",
        "tomcat.sessions.alive.max",
        "tomcat.sessions.created",
        "tomcat.sessions.expired",
        "tomcat.sessions.rejected",
        "zipkin.reporter.messages",
        "zipkin.reporter.messages.dropped",
        "zipkin.reporter.messages.total",
        "zipkin.reporter.queue.bytes",
        "zipkin.reporter.queue.spans",
        "zipkin.reporter.spans",
        "zipkin.reporter.spans.dropped",
        "zipkin.reporter.spans.total"
    ]
}
Prometheus exposed metrics at http://localhost:8080/app/actuator/prometheus
# HELP resilience4jcircuitbreakernotpermittedcalls_total Total number of not permitted calls
TYPE resilience4jcircuitbreakernotpermittedcalls_total counter
resilience4jcircuitbreakernotpermittedcallstotal{kind="notpermitted",name="proxyService",} 0.0
HELP jvmgclivedatasize_bytes Size of long-lived heap memory pool after reclamation
TYPE jvmgclivedatasize_bytes gauge
jvmgclivedatasize_bytes 3721880.0
HELP jvmgcpause_seconds Time spent in GC pause
TYPE jvmgcpause_seconds summary
jvmgcpausesecondscount{action="end of minor GC",cause="Metadata GC Threshold",} 1.0
jvmgcpausesecondssum{action="end of minor GC",cause="Metadata GC Threshold",} 0.071
jvmgcpausesecondscount{action="end of minor GC",cause="G1 Evacuation Pause",} 6.0
jvmgcpausesecondssum{action="end of minor GC",cause="G1 Evacuation Pause",} 0.551
HELP jvmgcpausesecondsmax Time spent in GC pause
TYPE jvmgcpausesecondsmax gauge
jvmgcpausesecondsmax{action="end of minor GC",cause="Metadata GC Threshold",} 0.071
jvmgcpausesecondsmax{action="end of minor GC",cause="G1 Evacuation Pause",} 0.136
HELP systemcpuusage The "recent cpu usage" for the whole system
TYPE systemcpuusage gauge
systemcpuusage 0.4069206655413552
HELP jvmbuffertotalcapacitybytes An estimate of the total capacity of the buffers in this pool
TYPE jvmbuffertotalcapacitybytes gauge
jvmbuffertotalcapacitybytes{id="mapped",} 0.0
jvmbuffertotalcapacitybytes{id="direct",} 24576.0
HELP zipkinreporterspansdroppedtotal Spans dropped (failed to report)
TYPE zipkinreporterspansdroppedtotal counter
zipkinreporterspansdroppedtotal 4.0
HELP zipkinreporterspansbytestotal Total bytes of encoded spans reported
TYPE zipkinreporterspansbytestotal counter
zipkinreporterspansbytestotal 1681.0
HELP tomcatsessionsactivecurrentsessions
TYPE tomcatsessionsactivecurrentsessions gauge
tomcatsessionsactivecurrentsessions 0.0
HELP jvmclassesloaded_classes The number of classes that are currently loaded in the Java virtual machine
TYPE jvmclassesloaded_classes gauge
jvmclassesloaded_classes 13714.0
HELP processfilesopen_files The open file descriptor count
TYPE processfilesopen_files gauge
processfilesopen_files 17.0
HELP resilience4jcircuitbreakerslowcallrate The slow call of the circuit breaker
TYPE resilience4jcircuitbreakerslowcallrate gauge
resilience4jcircuitbreakerslowcallrate{name="proxyService",} -1.0
HELP systemcpucount The number of processors available to the Java virtual machine
TYPE systemcpucount gauge
systemcpucount 8.0
HELP jvmthreadsdaemon_threads The current number of live daemon threads
TYPE jvmthreadsdaemon_threads gauge
jvmthreadsdaemon_threads 21.0
HELP zipkinreportermessages_total Messages reported (or attempted to be reported)
TYPE zipkinreportermessages_total counter
zipkinreportermessages_total 2.0
HELP zipkinreportermessagesdroppedtotal
TYPE zipkinreportermessagesdroppedtotal counter
zipkinreportermessagesdroppedtotal{cause="ResourceAccessException",} 2.0
HELP zipkinreportermessagesbytestotal Total bytes of messages reported
TYPE zipkinreportermessagesbytestotal counter
zipkinreportermessagesbytestotal 1368.0
HELP httpserverrequests_seconds
TYPE httpserverrequests_seconds summary
httpserverrequestssecondscount{exception="None",method="GET",outcome="SUCCESS",status="200",uri="/actuator/metrics",} 1.0
httpserverrequestssecondssum{exception="None",method="GET",outcome="SUCCESS",status="200",uri="/actuator/metrics",} 1.339804427
httpserverrequestssecondscount{exception="None",method="GET",outcome="SUCCESS",status="200",uri="/actuator/prometheus",} 1.0
httpserverrequestssecondssum{exception="None",method="GET",outcome="SUCCESS",status="200",uri="/actuator/prometheus",} 0.053689381
HELP httpserverrequestssecondsmax
TYPE httpserverrequestssecondsmax gauge
httpserverrequestssecondsmax{exception="None",method="GET",outcome="SUCCESS",status="200",uri="/actuator/metrics",} 1.339804427
httpserverrequestssecondsmax{exception="None",method="GET",outcome="SUCCESS",status="200",uri="/actuator/prometheus",} 0.053689381
HELP resilience4jcircuitbreakerslow_calls The number of slow successful which were slower than a certain threshold
TYPE resilience4jcircuitbreakerslow_calls gauge
resilience4jcircuitbreakerslow_calls{kind="successful",name="proxyService",} 0.0
resilience4jcircuitbreakerslow_calls{kind="failed",name="proxyService",} 0.0
HELP jvmclassesunloadedclassestotal The total number of classes unloaded since the Java virtual machine has started execution
TYPE jvmclassesunloadedclassestotal counter
jvmclassesunloadedclassestotal 0.0
HELP processfilesmax_files The maximum file descriptor count
TYPE processfilesmax_files gauge
processfilesmax_files 1048576.0
HELP resilience4jcircuitbreakercalls_seconds Total number of successful calls
TYPE resilience4jcircuitbreakercalls_seconds summary
resilience4jcircuitbreakercallssecondscount{kind="successful",name="proxyService",} 0.0
resilience4jcircuitbreakercallssecondssum{kind="successful",name="proxyService",} 0.0
resilience4jcircuitbreakercallssecondscount{kind="failed",name="proxyService",} 0.0
resilience4jcircuitbreakercallssecondssum{kind="failed",name="proxyService",} 0.0
resilience4jcircuitbreakercallssecondscount{kind="ignored",name="proxyService",} 0.0
resilience4jcircuitbreakercallssecondssum{kind="ignored",name="proxyService",} 0.0
HELP resilience4jcircuitbreakercallssecondsmax Total number of successful calls
TYPE resilience4jcircuitbreakercallssecondsmax gauge
resilience4jcircuitbreakercallssecondsmax{kind="successful",name="proxyService",} 0.0
resilience4jcircuitbreakercallssecondsmax{kind="failed",name="proxyService",} 0.0
resilience4jcircuitbreakercallssecondsmax{kind="ignored",name="proxyService",} 0.0
HELP zipkinreporterspans_total Spans reported
TYPE zipkinreporterspans_total counter
zipkinreporterspans_total 5.0
HELP zipkinreporterqueue_bytes Total size of all encoded spans queued for reporting
TYPE zipkinreporterqueue_bytes gauge
zipkinreporterqueue_bytes 0.0
HELP tomcatsessionsexpiredsessionstotal
TYPE tomcatsessionsexpiredsessionstotal counter
tomcatsessionsexpiredsessionstotal 0.0
HELP tomcatsessionsalivemaxseconds
TYPE tomcatsessionsalivemaxseconds gauge
tomcatsessionsalivemaxseconds 0.0
HELP processuptimeseconds The uptime of the Java virtual machine
TYPE processuptimeseconds gauge
processuptimeseconds 224.402
HELP tomcatsessionsactivemaxsessions
TYPE tomcatsessionsactivemaxsessions gauge
tomcatsessionsactivemaxsessions 0.0
HELP processcpuusage The "recent cpu usage" for the Java Virtual Machine process
TYPE processcpuusage gauge
processcpuusage 5.625879043600563E-4
HELP jvmgcmemorypromotedbytes_total Count of positive increases in the size of the old generation memory pool before GC to after GC
TYPE jvmgcmemorypromotedbytes_total counter
jvmgcmemorypromotedbytes_total 1.7851088E7
HELP logbackeventstotal Number of error level events that made it to the logs
TYPE logbackeventstotal counter
logbackeventstotal{level="warn",} 5.0
logbackeventstotal{level="debug",} 79.0
logbackeventstotal{level="error",} 0.0
logbackeventstotal{level="trace",} 0.0
logbackeventstotal{level="info",} 60.0
HELP tomcatsessionscreatedsessionstotal
TYPE tomcatsessionscreatedsessionstotal counter
tomcatsessionscreatedsessionstotal 0.0
HELP jvmthreadslive_threads The current number of live threads including both daemon and non-daemon threads
TYPE jvmthreadslive_threads gauge
jvmthreadslive_threads 25.0
HELP jvmthreadsstates_threads The current number of threads having NEW state
TYPE jvmthreadsstates_threads gauge
jvmthreadsstates_threads{state="runnable",} 6.0
jvmthreadsstates_threads{state="blocked",} 0.0
jvmthreadsstates_threads{state="waiting",} 8.0
jvmthreadsstates_threads{state="timed-waiting",} 11.0
jvmthreadsstates_threads{state="new",} 0.0
jvmthreadsstates_threads{state="terminated",} 0.0
HELP tomcatsessionsrejectedsessionstotal
TYPE tomcatsessionsrejectedsessionstotal counter
tomcatsessionsrejectedsessionstotal 0.0
HELP processstarttime_seconds Start time of the process since unix epoch.
TYPE processstarttime_seconds gauge
processstarttime_seconds 1.64088634006E9
HELP resilience4jcircuitbreakerbuffered_calls The number of buffered failed calls stored in the ring buffer
TYPE resilience4jcircuitbreakerbuffered_calls gauge
resilience4jcircuitbreakerbuffered_calls{kind="successful",name="proxyService",} 0.0
resilience4jcircuitbreakerbuffered_calls{kind="failed",name="proxyService",} 0.0
HELP jvmmemorymax_bytes The maximum amount of memory in bytes that can be used for memory management
TYPE jvmmemorymax_bytes gauge
jvmmemorymax_bytes{area="nonheap",id="CodeHeap 'profiled nmethods'",} 1.22908672E8
jvmmemorymax_bytes{area="heap",id="G1 Survivor Space",} -1.0
jvmmemorymax_bytes{area="heap",id="G1 Old Gen",} 5.182062592E9
jvmmemorymax_bytes{area="nonheap",id="Metaspace",} -1.0
jvmmemorymax_bytes{area="nonheap",id="CodeHeap 'non-nmethods'",} 5836800.0
jvmmemorymax_bytes{area="heap",id="G1 Eden Space",} -1.0
jvmmemorymax_bytes{area="nonheap",id="Compressed Class Space",} 1.073741824E9
jvmmemorymax_bytes{area="nonheap",id="CodeHeap 'non-profiled nmethods'",} 1.22912768E8
HELP jvmmemorycommitted_bytes The amount of memory in bytes that is committed for the Java virtual machine to use
TYPE jvmmemorycommitted_bytes gauge
jvmmemorycommitted_bytes{area="nonheap",id="CodeHeap 'profiled nmethods'",} 1.6646144E7
jvmmemorycommitted_bytes{area="heap",id="G1 Survivor Space",} 2.4117248E7
jvmmemorycommitted_bytes{area="heap",id="G1 Old Gen",} 1.7301504E8
jvmmemorycommitted_bytes{area="nonheap",id="Metaspace",} 7.6857344E7
jvmmemorycommitted_bytes{area="nonheap",id="CodeHeap 'non-nmethods'",} 2555904.0
jvmmemorycommitted_bytes{area="heap",id="G1 Eden Space",} 2.71581184E8
jvmmemorycommitted_bytes{area="nonheap",id="Compressed Class Space",} 1.0354688E7
jvmmemorycommitted_bytes{area="nonheap",id="CodeHeap 'non-profiled nmethods'",} 6619136.0
HELP jvmmemoryused_bytes The amount of used memory
TYPE jvmmemoryused_bytes gauge
jvmmemoryused_bytes{area="nonheap",id="CodeHeap 'profiled nmethods'",} 1.6585088E7
jvmmemoryused_bytes{area="heap",id="G1 Survivor Space",} 2.4117248E7
jvmmemoryused_bytes{area="heap",id="G1 Old Gen",} 2.0524392E7
jvmmemoryused_bytes{area="nonheap",id="Metaspace",} 7.4384552E7
jvmmemoryused_bytes{area="nonheap",id="CodeHeap 'non-nmethods'",} 1261696.0
jvmmemoryused_bytes{area="heap",id="G1 Eden Space",} 2.5165824E7
jvmmemoryused_bytes{area="nonheap",id="Compressed Class Space",} 9365664.0
jvmmemoryused_bytes{area="nonheap",id="CodeHeap 'non-profiled nmethods'",} 6604416.0
HELP systemloadaverage_1m The sum of the number of runnable entities queued to available processors and the number of runnable entities running on the available processors averaged over a period of time
TYPE systemloadaverage_1m gauge
systemloadaverage_1m 8.68
HELP resilience4jcircuitbreakerstate The states of the circuit breaker
TYPE resilience4jcircuitbreakerstate gauge
resilience4jcircuitbreakerstate{name="proxyService",state="forced_open",} 0.0
resilience4jcircuitbreakerstate{name="proxyService",state="closed",} 1.0
resilience4jcircuitbreakerstate{name="proxyService",state="disabled",} 0.0
resilience4jcircuitbreakerstate{name="proxyService",state="open",} 0.0
resilience4jcircuitbreakerstate{name="proxyService",state="half_open",} 0.0
resilience4jcircuitbreakerstate{name="proxyService",state="metrics_only",} 0.0
HELP jvmbuffermemoryusedbytes An estimate of the memory that the Java virtual machine is using for this buffer pool
TYPE jvmbuffermemoryusedbytes gauge
jvmbuffermemoryusedbytes{id="mapped",} 0.0
jvmbuffermemoryusedbytes{id="direct",} 24576.0
HELP resilience4jcircuitbreakerfailure_rate The failure rate of the circuit breaker
TYPE resilience4jcircuitbreakerfailure_rate gauge
resilience4jcircuitbreakerfailure_rate{name="proxyService",} -1.0
HELP zipkinreporterqueue_spans Spans queued for reporting
TYPE zipkinreporterqueue_spans gauge
zipkinreporterqueue_spans 0.0
HELP jvmgcmemoryallocatedbytes_total Incremented for an increase in the size of the (young) heap memory pool after one GC to before the next
TYPE jvmgcmemoryallocatedbytes_total counter
jvmgcmemoryallocatedbytes_total 1.402994688E9
HELP jvmbuffercount_buffers An estimate of the number of buffers in the pool
TYPE jvmbuffercount_buffers gauge
jvmbuffercount_buffers{id="mapped",} 0.0
jvmbuffercount_buffers{id="direct",} 3.0
HELP jvmthreadspeak_threads The peak live thread count since the Java virtual machine started or peak was reset
TYPE jvmthreadspeak_threads gauge
jvmthreadspeak_threads 25.0
HELP jvmgcmaxdatasize_bytes Max size of long-lived heap memory pool
TYPE jvmgcmaxdatasize_bytes gauge
jvmgcmaxdatasize_bytes 5.182062592E9
Check All Services Health
From ecommerce front Service proxy we can check all the core services health when you have all the microservices up and running using Docker Compose,selim@:~/ecommerce-microservice-backend-app$ curl -k https://localhost:8443/actuator/health -s | jq .components."\"Core Microservices\""{
"status": "UP",
"components": {
"circuitBreakers": {
"status": "UP",
"details": {
"proxyService": {
"status": "UP",
"details": {
"failureRate": "-1.0%",
"failureRateThreshold": "50.0%",
"slowCallRate": "-1.0%",
"slowCallRateThreshold": "100.0%",
"bufferedCalls": 0,
"slowCalls": 0,
"slowFailedCalls": 0,
"failedCalls": 0,
"notPermittedCalls": 0,
"state": "CLOSED"
}
}
}
},
"clientConfigServer": {
"status": "UNKNOWN",
"details": {
"error": "no property sources located"
}
},
"discoveryComposite": {
"status": "UP",
"components": {
"discoveryClient": {
"status": "UP",
"details": {
"services": [
"proxy-client",
"api-gateway",
"cloud-config",
"product-service",
"user-service",
"favourite-service",
"order-service",
"payment-service",
"shipping-service"
]
}
},
"eureka": {
"description": "Remote status from Eureka server",
"status": "UP",
"details": {
"applications": {
"FAVOURITE-SERVICE": 1,
"PROXY-CLIENT": 1,
"API-GATEWAY": 1,
"PAYMENT-SERVICE": 1,
"ORDER-SERVICE": 1,
"CLOUD-CONFIG": 1,
"PRODUCT-SERVICE": 1,
"SHIPPING-SERVICE": 1,
"USER-SERVICE": 1
}
}
}
}
},
"diskSpace": {
"status": "UP",
"details": {
"total": 981889826816,
"free": 325116776448,
"threshold": 10485760,
"exists": true
}
},
"ping": {
"status": "UP"
},
"refreshScope": {
"status": "UP"
}
}
}Testing Them All
Now it's time to test all the application functionality as one part. To do so just run the following automation test script:selim@:~/ecommerce-microservice-backend-app$ ./test-em-all.sh startYou can use>1. start docker, >2. run the tests, >3. stop the docker instances.stopswitch withstart, that will
The result will look like this:
Starting 'ecommerce-microservice-backend-app' for [Blackbox] testing...
Start Tests: Tue, May 31, 2020 2:09:36 AM HOST=localhost PORT=8080 Restarting the test environment... $ docker-compose -p -f compose.yml down --remove-orphans $ docker-compose -p -f compose.yml up -d Wait for: curl -k https://localhost:8080/actuator/health... , retry #1 , retry #2, {"status":"UP"} DONE, continues... Test OK (HTTP Code: 200) ... Test OK (actual value: 1) Test OK (actual value: 3) Test OK (actual value: 3) Test OK (HTTP Code: 404, {"httpStatus":"NOT_FOUND","message":"No product found for productId: 13","path":"/app/api/products/20","time":"2020-04-12@12:34:25.144+0000"}) ... Test OK (actual value: 3) Test OK (actual value: 0) Test OK (HTTP Code: 422, {"httpStatus":"UNPROCESSABLE_ENTITY","message":"Invalid productId: -1","path":"/app/api/products/-1","time":"2020-04-12@12:34:26.243+0000"}) Test OK (actual value: "Invalid productId: -1") Test OK (HTTP Code: 400, {"timestamp":"2020-04-12T12:34:26.471+00:00","path":"/app/api/products/invalidProductId","status":400,"error":"Bad Request","message":"Type mismatch.","requestId":"044dcdf2-13"}) Test OK (actual value: "Type mismatch.") Test OK (HTTP Code: 401, ) Test OK (HTTP Code: 200) Test OK (HTTP Code: 403, ) Start Circuit Breaker tests! Test OK (actual value: CLOSED) Test OK (HTTP Code: 500, {"timestamp":"2020-05-26T00:09:48.784+00:00","path":"/app/api/products/2","status":500,"error":"Internal Server Error","message":"Did not observe any item or terminal signal within 2000ms in 'onErrorResume' (and no fallback has been configured)","requestId":"4aa9f5e8-119"}) ... Test OK (actual value: Did not observe any item or terminal signal within 2000ms) Test OK (HTTP Code: 200) Test OK (actual value: Fallback product2) Test OK (HTTP Code: 200) Test OK (actual value: Fallback product2) Test OK (HTTP Code: 404, {"httpStatus":"NOT_FOUND","message":"Product Id: 14 not found in fallback cache!","path":"/app/api/products/14","timestamp":"2020-05-26@00:09:53.998+0000"}) ... Test OK (actual value: product name C) Test OK (actual value: CLOSED) Test OK (actual value: CLOSEDTOOPEN) Test OK (actual value: OPENTOHALF_OPEN) Test OK (actual value: HALFOPENTO_CLOSED) End, all tests OK: Tue, May 31, 2020 2:10:09 AM
Tracking the services with Zipkin
Now, you can now track Microservices interactions throughout Zipkin UI from the following link: http://localhost:9411/zipkin/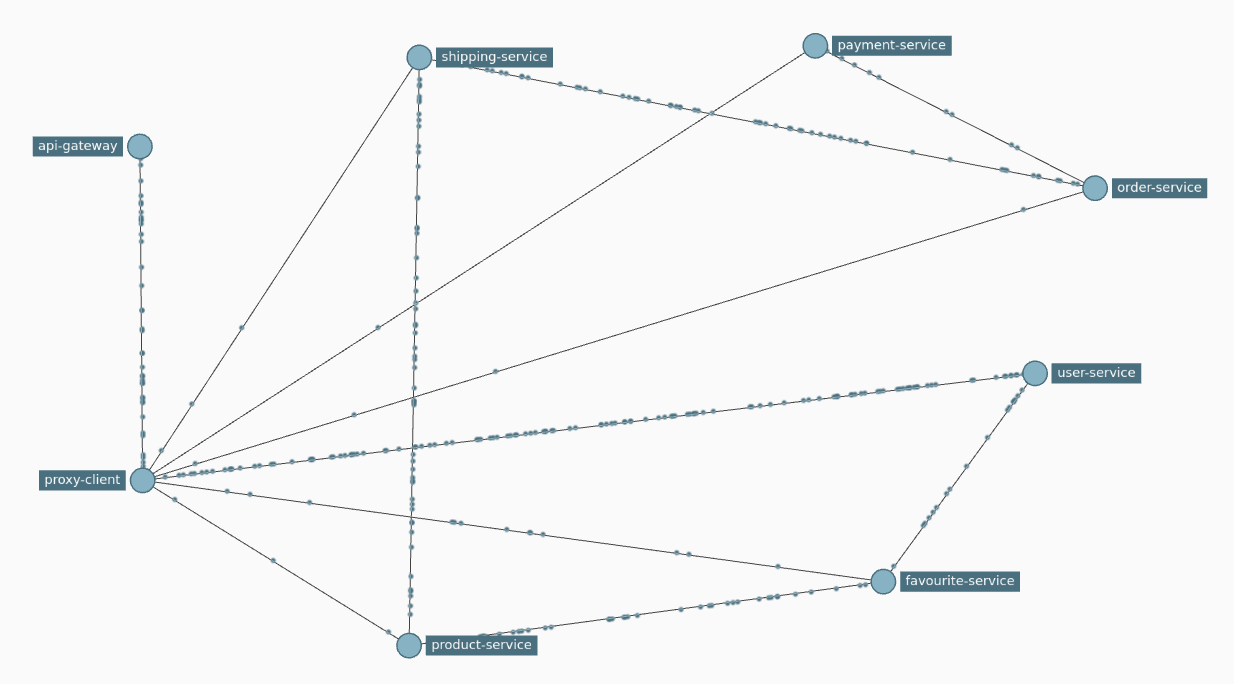
Closing The Story
Finally, to close the story, we need to shut down Microservices manually service by service, hahaha just kidding, run the following command to shut them all:
selim@:~/ecommerce-microservice-backend-app$ docker-compose -f compose.yml down --remove-orphansRemoving ecommerce-microservice-backend-apppayment-service-container1 ... done
Removing ecommerce-microservice-backend-appzipkin-container1 ... done
Removing ecommerce-microservice-backend-appservice-discovery-container1 ... done
Removing ecommerce-microservice-backend-appproduct-service-container1 ... done
Removing ecommerce-microservice-backend-appcloud-config-container1 ... done
Removing ecommerce-microservice-backend-appproxy-client-container1 ... done
Removing ecommerce-microservice-backend-apporder-service-container1 ... done
Removing ecommerce-microservice-backend-appuser-service-container1 ... done
Removing ecommerce-microservice-backend-appshipping-service-container1 ... done
Removing ecommerce-microservice-backend-appapi-gateway-container1 ... done
Removing ecommerce-microservice-backend-appfavourite-service-container1 ... done
Removing network ecommerce-microservice-backend-app_defaultThe End
In the end, I hope you enjoyed the application and find it useful, as I did when I was developing it. If you would like to enhance, please:- Open PRs,
- Give feedback,
- Add new suggestions, and
- Finally, give it a 🌟.


