
UNMAINTAINED | R-package providing access to fundamental data and valuation metrics for thousands of publicly traded companies worldwide.
Fetching Stock Data for Fundamental Analysis
The project relies on data provided by gurufocus.com and tipranks.com
This webscraping toolset provides functionalities for easily gathering stock data for up to the last five fiscal years.
📚 Extensive data for 6.000+ unique listings.
:memo: More than 50 different metrics.
📅 Data for the company's last five fiscal years and current years TTM value.
♻️ Convenient merging-abilities for updating past scraping results.
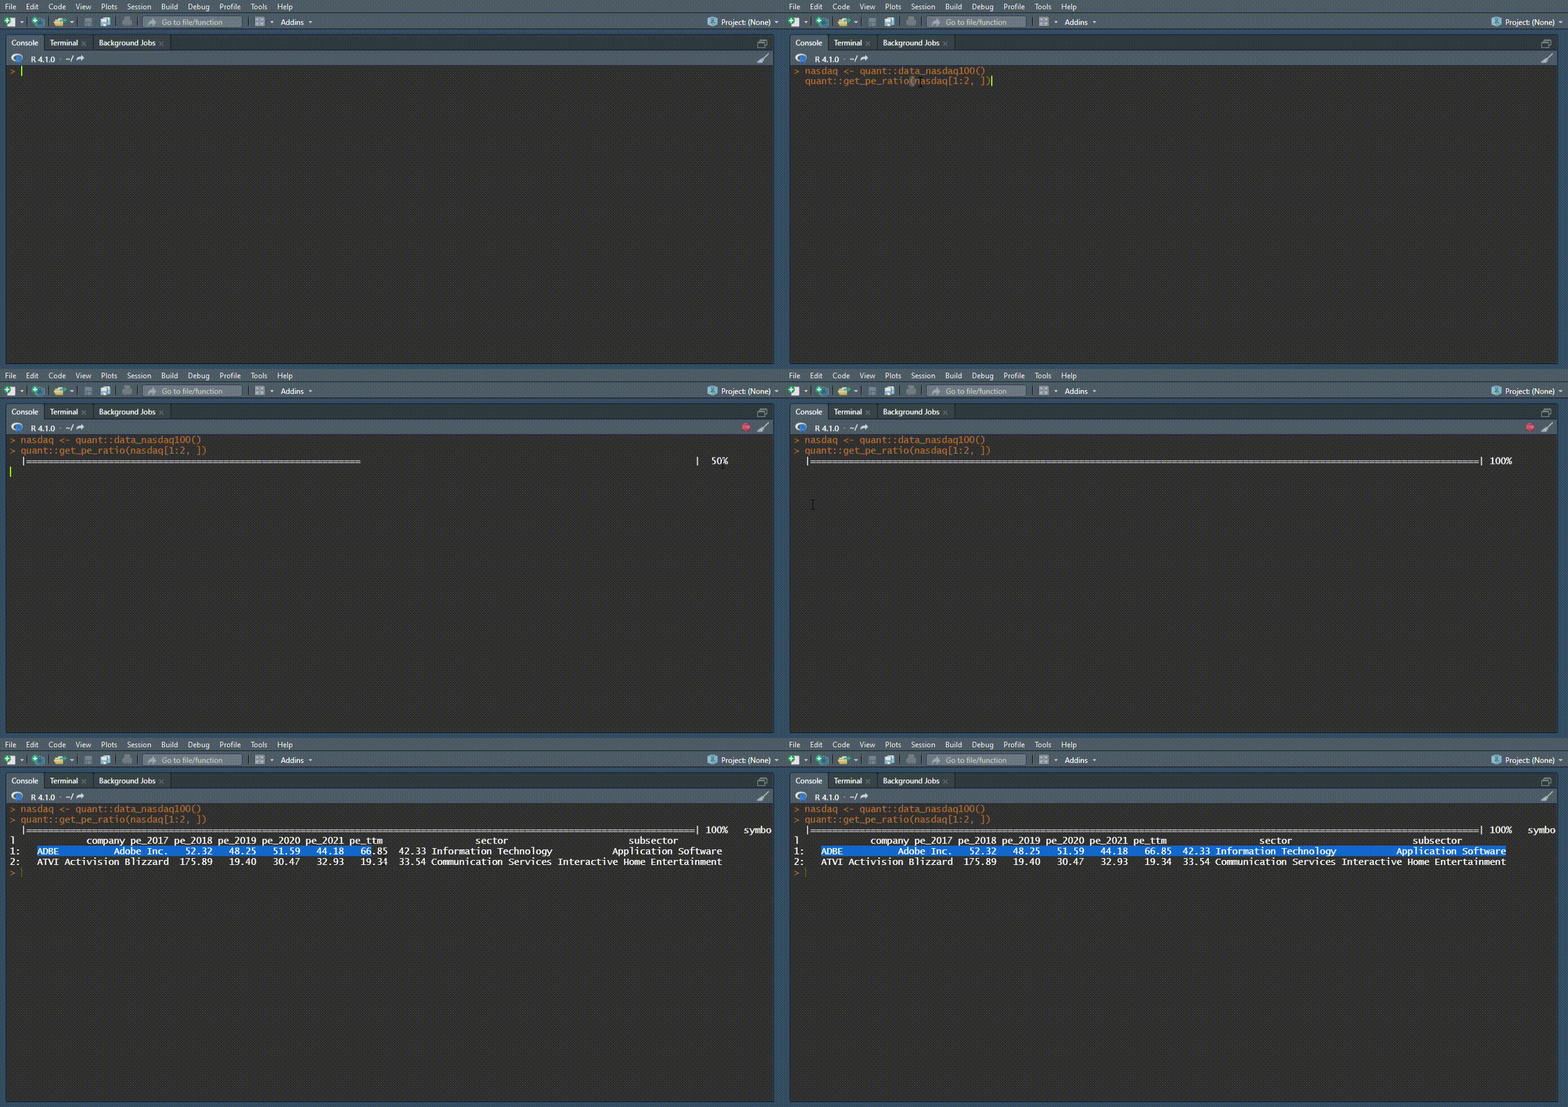
Demo
Prerequisite
Note that the installation of 'quant' requires RTools in order to build R and R packages from source on Windows.
Installation
# Github Download 'quant'-package (dev version)
devtools::install_github('OliverHennhoefer/quant')
Application
df <- data.frame("symbol" = c("AAPL", "MSFT", "BABA"))
Diluted Earnings per Share
df %>%
  getdilutedeps()

>   Symbol EPS2017 EPS2018  EPS2019  EPS2020  EPS2021  EPSTTM
  1 AAPL   2.30    2.98       2.97      3.28      5.61      6.04
  2 BABA   2.46    3.88       4.97      7.97      8.40      3.74
  3 MSFT   3.25    2.13       5.06      5.76      8.05      9.39
Easily fetch several data for the most common financial measures or even more uncustomary ratios:
df <- data.frame("symbol" = c("AAPL", "MSFT", "BABA"))
Profitability Rank, Probability of Financial Distress
df %>%
  get_profitability() %>%
  getfinancialdistress()

>   Symbol Fin.Distress  Profitability
  1 AAPL   0.02          10
  2 BABA   0.29          9
  3 MSFT   0.03          10
Data Providers
gurufocus.comtipranks.com
wikipedia.com


