
A high-performance trade bot built with C++ designed for cryptocurrency markets. This bot leverages efficient algorithms and multithreading to execute trades based on user-defined strategies. Includes features like real-time market data analysis, customizable trading parameters, and risk management tools.
Last updated Jun 29, 2026
22
Stars
5
Forks
1
Issues
0
Stars/day
Attention Score
14
Language breakdown
No language data available.
▸ Files
click to expand
README
Trader_Bot
Author:
Ali Şahbaz 📧 Email: ali_sahbaz@outlook.comDescription
Trader_Bot is a high-performance trade bot built with C++ and Qt Framework 6.7.1, specifically designed for cryptocurrency markets. This bot leverages advanced algorithms, multithreading, and real-time data analysis to execute trades based on user-defined strategies. With its customizable parameters and robust risk management tools, it serves as a powerful tool for both backtesting and live trading.Required Expertise & Keywords
This project requires expertise in the following areas:- Quant Developer: Building high-performance algorithms for financial markets.
- HFT Algorithms: High-frequency trading strategies and systems.
- C++: Proficiency in C++ for developing performance-critical applications.
- Mathematics: Advanced mathematical models for financial data analysis and algorithmic trading.
- Finance: Understanding of financial markets, trading strategies, and risk management.
- Cryptocurrency Markets: Knowledge of cryptocurrency trading platforms and APIs.
- Multithreading: Efficient execution of concurrent tasks in high-performance applications.
- Technical Analysis: Use of indicators like Moving Averages, MACD, Bollinger Bands, etc.
- Backtesting: Designing and running tests for trading strategies using historical data.
Features
Core Functionalities
- Custom Graphics Processing: High-performance visualization tools for monitoring and analysis.
- Trade / HFT Algorithm Integration: Implements cutting-edge algorithms for high-frequency trading.
- Modern Software Patterns: Employs advanced design patterns for maintainable and scalable development.
- Simplified Strategy Management: Easily add and test new trading strategies with minimal effort.
- Custom Binance WebSocket Library: Built for efficient real-time data retrieval and communication.
- Custom Binance REST API Implementation: Provides seamless interaction with Binance endpoints.
- Real-Time Testing: Direct testing of strategies with live market data.
- Backtesting Support: Analyze historical data to optimize and validate strategies.
- Fake Account Testing: Test strategies without risking actual funds.
- Custom OHLC Structures & Math Models: Supports complex calculations and high-precision operations.
- 20+ Pre-Built Strategies: Includes templates (
template_strategy.h) for creating your own strategies. - Comprehensive Logging Support: Provides detailed logs for debugging, analysis, and auditing.
- User-Friendly GUI: Offers an intuitive interface for traders to easily manage and monitor their trading activities.
Screenshots
1. Binance Fake Account & Realtime Monitoring
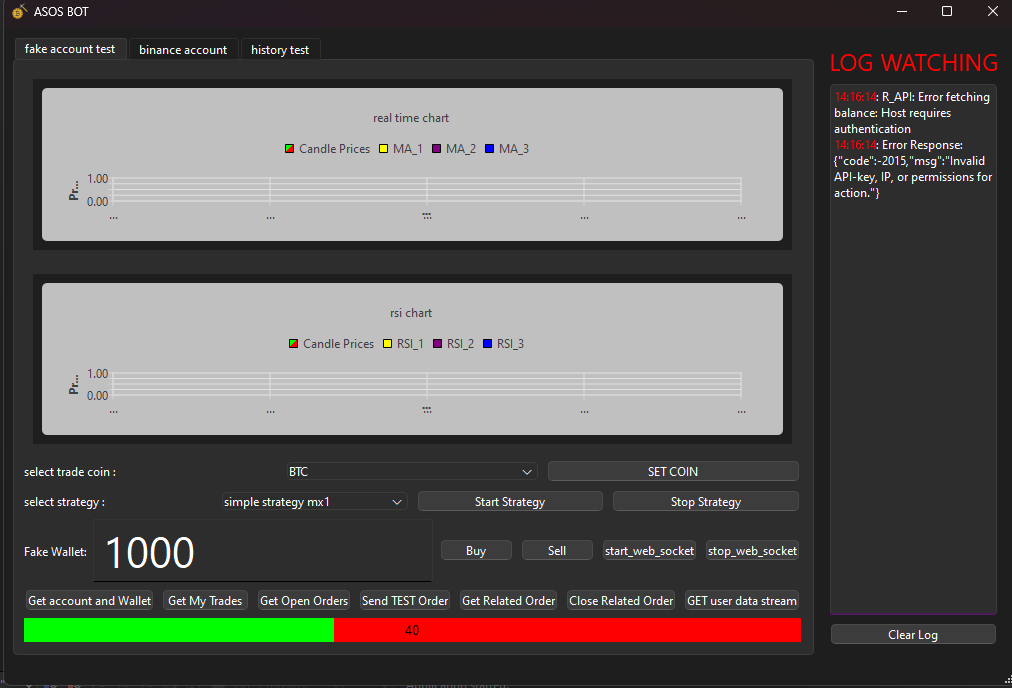 This page emulates a Binance account. It supports:
- Monitoring real-time coin data
- Placing buy/sell orders
- Integrating strategies
- Viewing open orders, wallet balance, and logs
2. History Testing Page
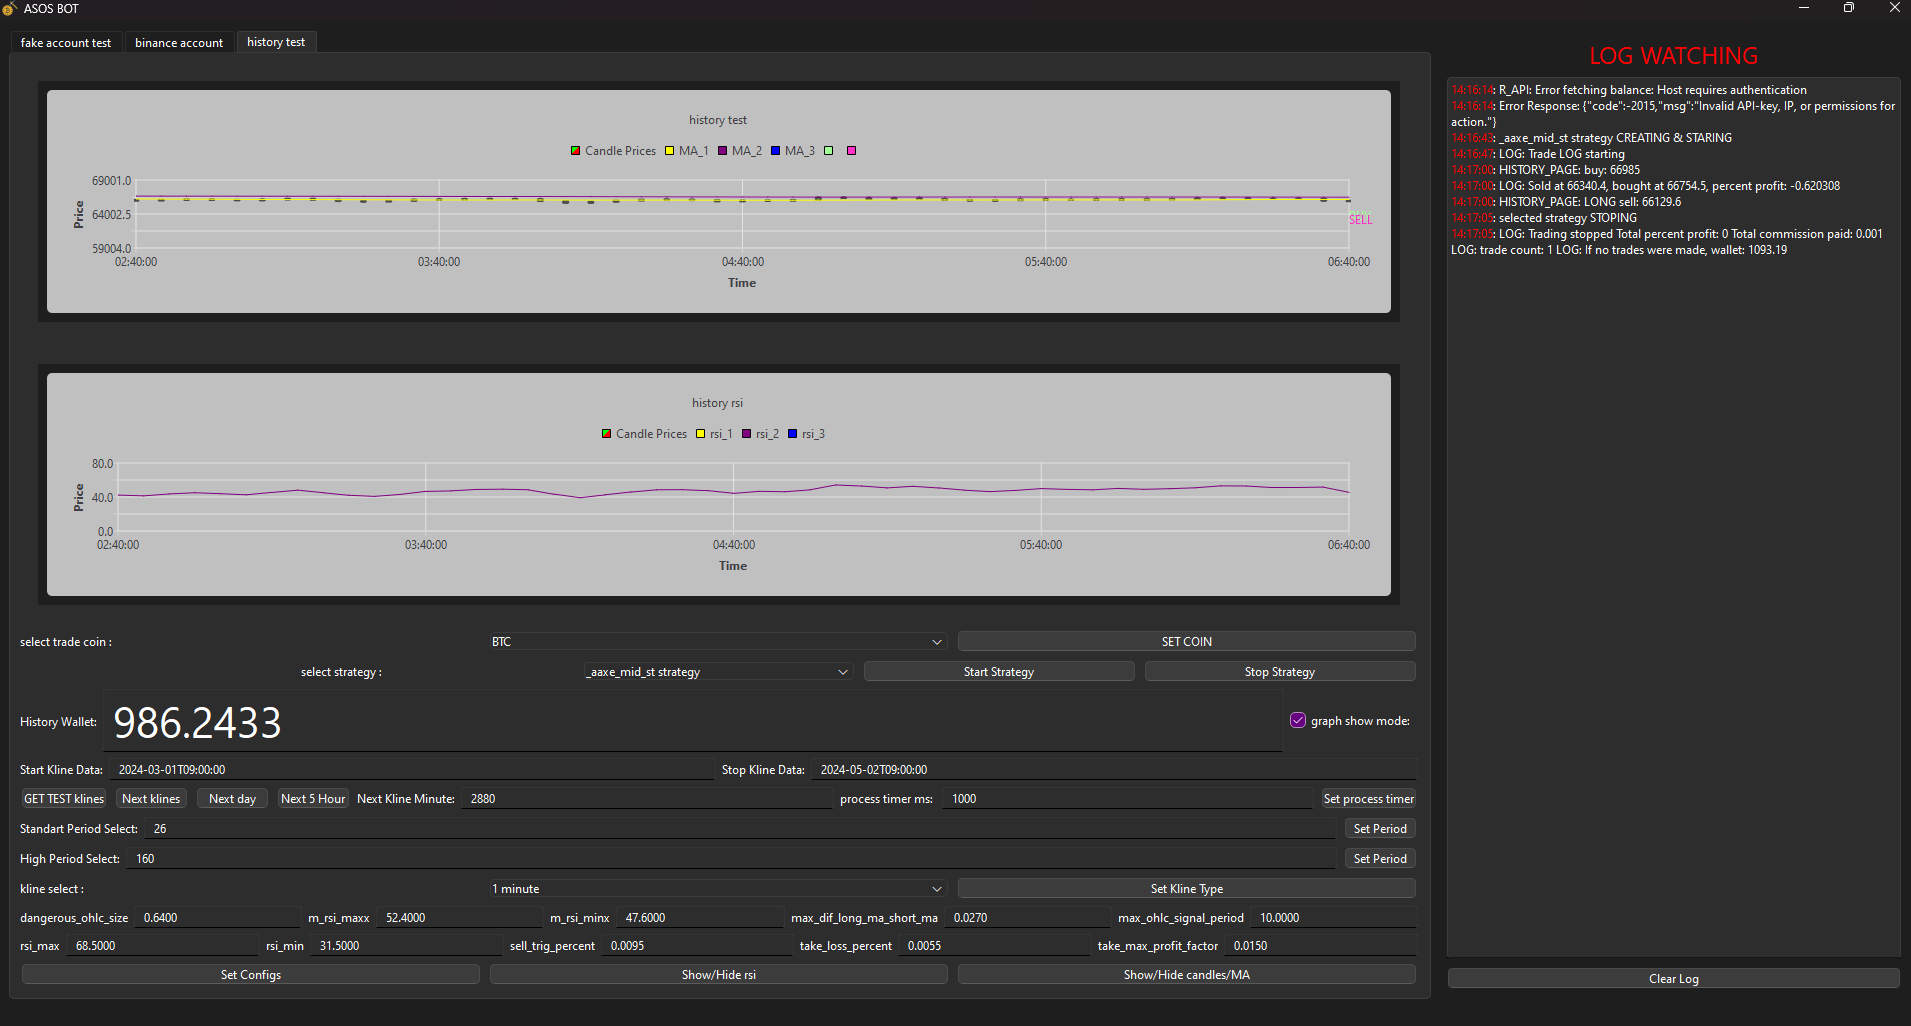 Provides an interface to visualize and analyze RSI and real-time data graphics. Features include:
- Configurable visibility of data elements
- Adjustable display settings
3. Strategy Testing & Backtesting
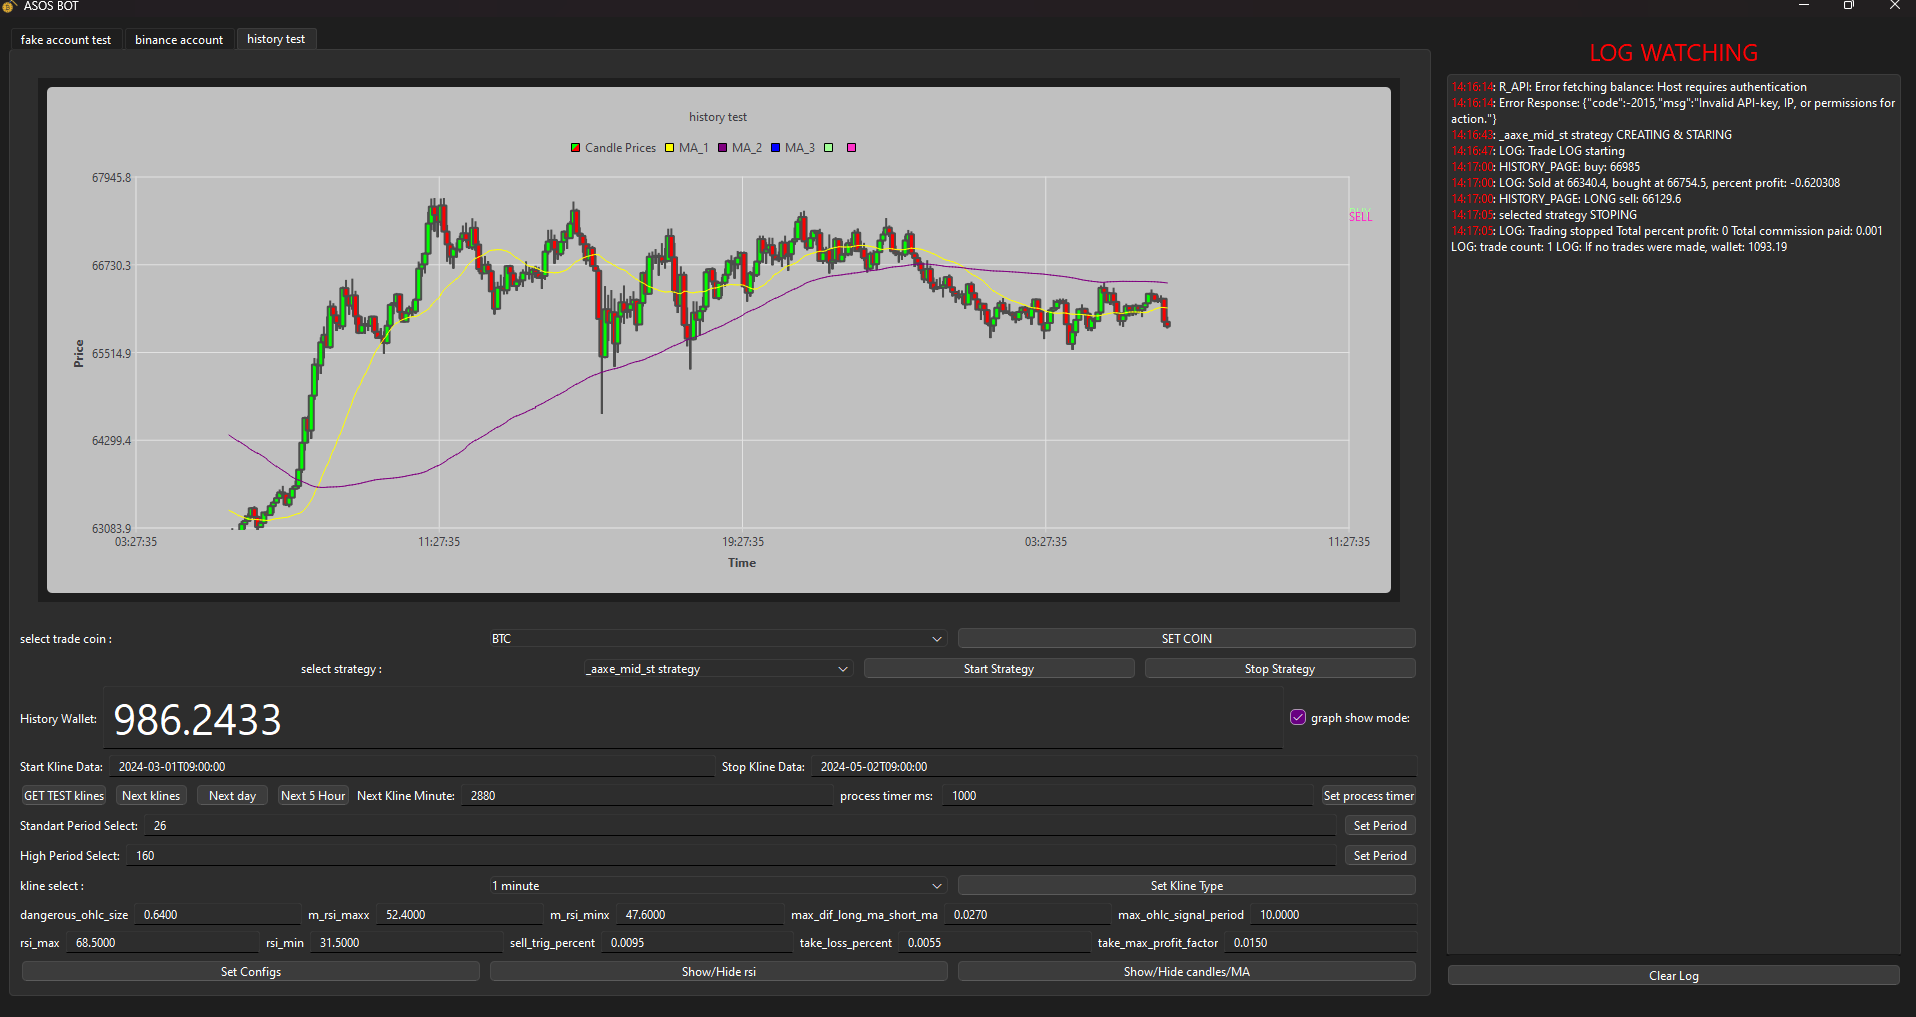 Allows users to:
- Select a strategy and a time range for backtesting
- Start testing and monitor data flow
- Control data flow speed via the GUI
- Log activities and set custom parameters for strategies
- Select coins and specify candle types, supporting up to second-level granularity
4. Visual Trade Analysis
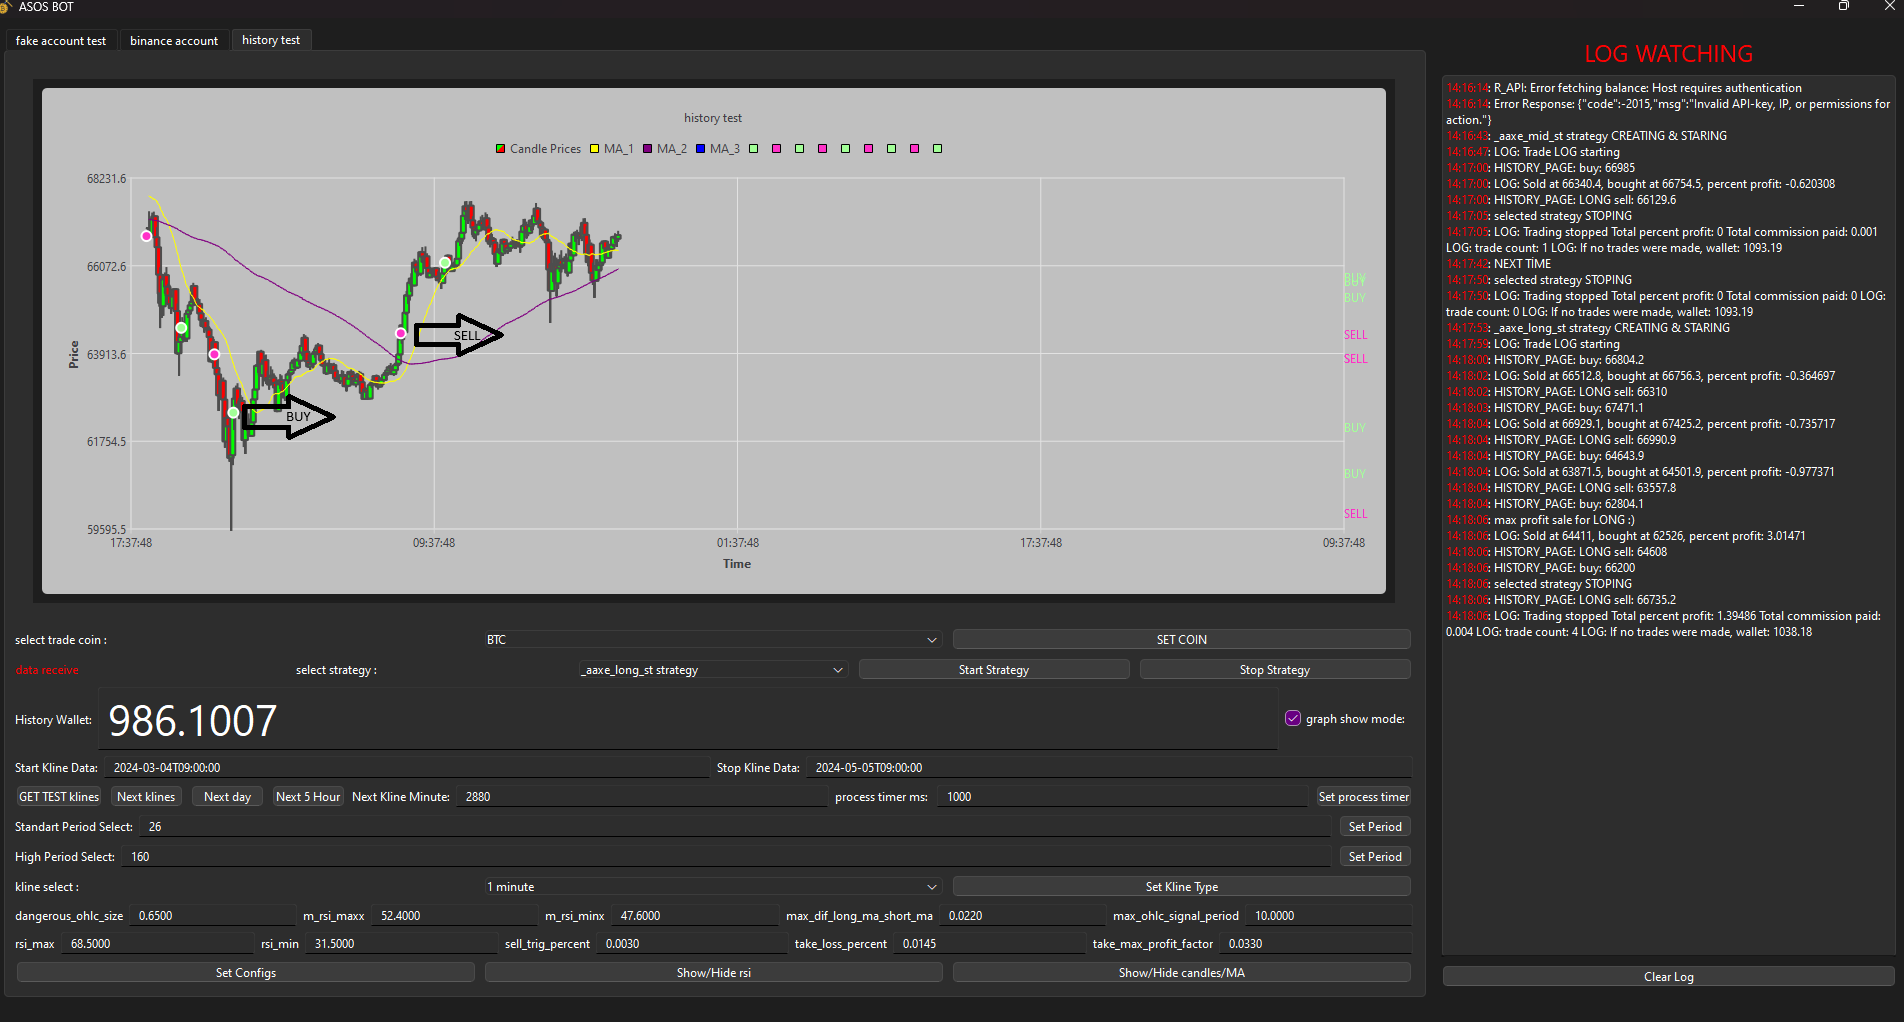 Displays LONG and SHORT orders directly on the graph. Features include:
- Analyzing past wallet performance
- Evaluating the strength of strategies through logs and graphical representations
Core Concepts & Indicators
1. Moving Average (MA)
The Moving Average (MA) calculates the average price movement of an asset over time. It helps traders smooth out price data and identify trends.Types of Moving Averages:
- Simple Moving Average (SMA):
- Exponential Moving Average (EMA):
Application in Trading: Moving Averages can act as support and resistance levels. When the price is above a moving average, it may be seen as a support level, while if the price is below, it can be seen as a resistance level.
Crossover Strategies:
- Golden Cross: When a short-term moving average crosses above a long-term moving average, it's a potential buy signal.
- Death Cross: When a short-term moving average crosses below a long-term moving average, it’s a potential sell signal.
2. MACD (Moving Average Convergence Divergence)
MACD is a momentum and trend-following indicator that shows the relationship between two moving averages of an asset's price.- The MACD line is calculated by subtracting the 26-period EMA from the 12-period EMA.
- The signal line is the 9-period EMA of the MACD line.
- Bullish signal: When the MACD crosses above the signal line.
- Bearish signal: When the MACD crosses below the signal line.
3. Bollinger Bands
Bollinger Bands are volatility indicators that consist of a middle band (SMA) and two outer bands that are standard deviations away from the middle band.- Upper Band: Represents overbought conditions.
- Lower Band: Represents oversold conditions.
- Price bouncing off the lower band may indicate a buy signal, and bouncing off the upper band may indicate a sell signal.
4. Fibonacci Retracement
Fibonacci retracement is a tool used to identify potential levels of support and resistance. The key Fibonacci levels are 23.6%, 38.2%, 50%, 61.8%, and 100%.Example:
- If the price rises from 100 to 200, traders may expect the price to retrace to levels such as 161.8% of the rise (161.8% of 100-200 move) before continuing the uptrend.
5. Stochastic Oscillator
The Stochastic Oscillator measures the level of the closing price relative to the high-low range over a specific period.- Overbought zone: Values above 80 indicate overbought conditions.
- Oversold zone: Values below 20 indicate oversold conditions.
- A buy signal occurs when the oscillator crosses from below 20 to above 20.
- A sell signal occurs when it crosses from above 80 to below 80.
6. Divergence
Divergence occurs when the price of an asset moves in the opposite direction of an indicator (such as MACD or RSI), potentially signaling a reversal.Example:
- Bullish Divergence: When prices form lower lows, but the indicator forms higher lows, suggesting potential upward momentum.
- Bearish Divergence: When prices form higher highs, but the indicator forms lower highs, suggesting potential downward momentum.
7. Parabolic SAR (Stop and Reverse)
The Parabolic SAR is a trend-following indicator that helps determine the potential reversal points in the market.- When the SAR is below the price, the trend is bullish, and when it is above the price, the trend is bearish.
8. Ichimoku Kinko Hyo
This is a Japanese technical analysis indicator that provides insights into the market’s trend, support and resistance levels, and potential future price movements. It consists of five lines:- Tenkan-sen: A fast-moving average.
- Kijun-sen: A slower-moving average.
- Senkou Span A and B: Leading lines forming the cloud, which indicates support or resistance.
- Chikou Span: The lagging line, showing the current price in relation to the past.
9. ATR (Average True Range)
The ATR measures volatility by calculating the average of true ranges (the difference between the high and low of an asset for a period). A higher ATR indicates higher volatility.10. Chaikin Money Flow (CMF)
CMF is a volume-weighted average of accumulation and distribution over a specified period. It measures the money flow of an asset.Interpretation:
- Positive CMF: Indicates accumulation (buying pressure).
- Negative CMF: Indicates distribution (selling pressure).
11. On-Balance Volume (OBV)
OBV is a cumulative indicator that adds volume on up days and subtracts volume on down days, helping to gauge the direction of the trend.12. Williams %R
Williams %R is a momentum indicator that measures overbought and oversold conditions.- Overbought: Values above -20.
- Oversold: Values below -80.
13. Economic Indicators
- CPI (Consumer Price Index): Measures the average change over time in the prices paid by consumers for goods and services.
- PPI (Producer Price Index): Measures the average change in selling prices received by domestic producers for their output.
- GDP (Gross Domestic Product): Represents the total value of goods and services produced by a country in a specific time period.
14. Option Greeks
- BETA: Measures an asset’s sensitivity to market movements.
- Delta: Measures the rate of change of an option’s price relative to the underlying asset’s price.
- Gamma: Measures the rate of change in delta.
- Vega: Measures an option's sensitivity to volatility.
- Theta: Measures the time decay of options.
- Rho: Measures an option's sensitivity to interest rate changes.
15. Trading Concepts
- Spread: The difference between an asset’s buying price and selling price.
- Margin: The amount of capital required to open a position.
- Leverage: Allows you to control a larger position with a smaller amount of capital.
- Drawdown: The decline from the highest value to the lowest during a particular period.
How to Use
- Clone the repository:


