
Relative Rotation Graphs (RRG) for Indian stock markets (NSE, NIFTY) to track sector rotation and relative strength. Uses RS-Ratio and RS-Momentum to identify outperforming and weakening sectors, based on the Julius de Kempenaer RRG methodology, adapted for Indian equity markets
RRG Chart Visualization: Sector Rotation Analysis
This project implements a Relative Rotation Graph (RRG) computation and visualization platform for sector rotation strategies and swing trading in the Indian equity market. The Julius de Kempenaer (JdK) Relative Rotation Graph methodology, widely used by professional traders in Western markets, is not freely available for the Indian market — this gap serves as the primary motivation behind this project. The platform implements both the standard JdK RRG methodology and an enhanced EMA-based variant that provides earlier signals and smoother transitions for timely investment and swing-trading decisions.
Why RRG Charts Matter
Relative Rotation Graphs identifies which sectors/stocks are rotating into and out of favor before the crowd recognizes the shift. Traditional analysis shows absolute performance, but RRG reveals relative strength and momentum - the two dimensions that drive sector rotation cycles.
The Power of Two Dimensions
RRG charts plot securities in a 2D space:
- X-axis (RS-Ratio): How strong is this security relative to the benchmark?
- Y-axis (RS-Momentum): Is the relative strength accelerating or decelerating?
Why This Matters for Swing Trading
- Early Entry Signals: Identify sectors moving from "Improving" to "Leading" before they become obvious
- Exit Timing: Recognize when "Leading" sectors transition to "Weakening"
- Risk Management: Avoid "Lagging" sectors with negative momentum
- Portfolio Rebalancing: Systematically rotate capital from weakening to improving sectors
Enhanced Formula Implementation
Our implementation uses EMA-based ratio normalization, a significant improvement over the standard JdK z-score methodology. This enhancement provides 2-3 periods faster signal detection and direct percentage interpretation - critical advantages for swing trading.
RS-Ratio Formula
Enhanced Implementation:
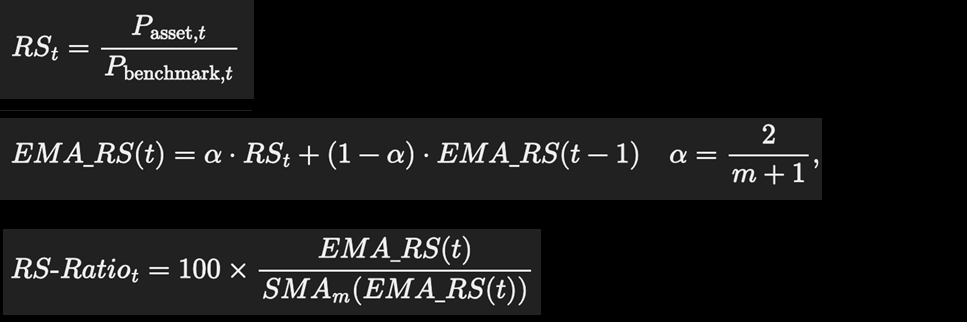
Formulas in Text:
RS = StockClose / BenchmarkClose
EMARS(t) = α × RS(t) + (1-α) × EMARS(t-1)            where α = 2/(m+1), m = 14 (default)
RSRatio = 100 × (EMARS / RollingMean(EMARS, m))
Key Advantages:
- EMA weighting: Recent data gets exponentially more weight → faster trend detection
- Ratio normalization: Direct interpretation (105 = 5% above recent average)
- Reduced lag: Responds 2-3 periods earlier than SMA-based methods
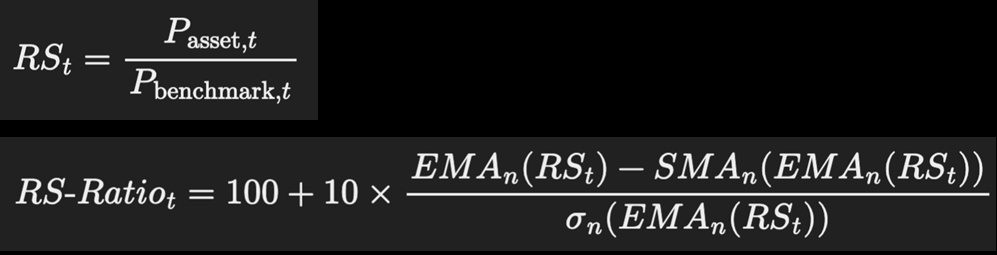
Formulas in Text:
RS = StockClose / BenchmarkClose
JdKRS(t) = α × RS(t) + (1-α) × JdKRS(t-1)            where α = 2/(m+1), m = 14 (default)
RSRatio = 100 + 10 × (JdKRS - RollingMean(JdKRS, m)) / RollingStdDev(JdKRS, m)
Note: Standard JdK uses EMA smoothing of RS followed by z-score normalization, providing a balance between responsiveness and statistical normalization.
RS-Momentum Formula
Enhanced Implementation:
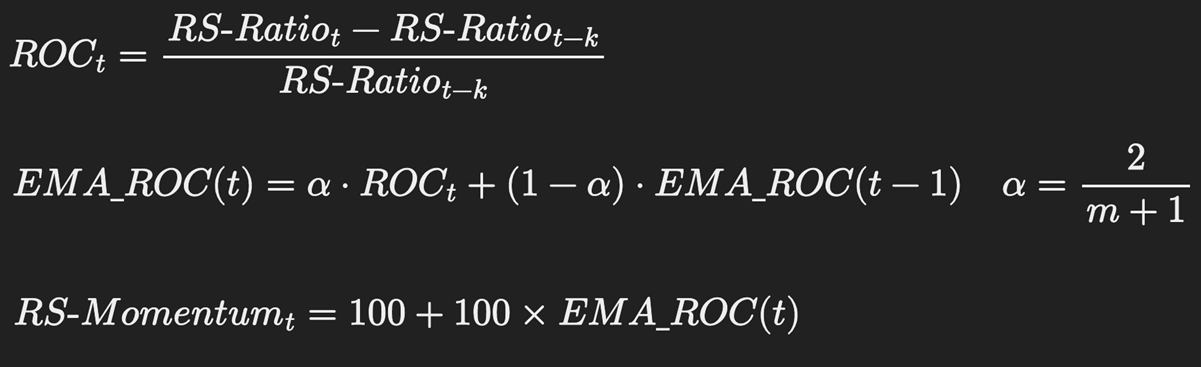
Formulas in Text:
ROC(t) = (RSRatio(t) - RSRatio(t-k)) / RS_Ratio(t-k)         where k = 10 (default, short-term momentum)
EMAROC(t) = α × ROC(t) + (1-α) × EMAROC(t-1)             where α = 2/(m+1), m = 14
RSMomentum = 100 + 100 × EMAROC
Key Advantages:
- Direct percentage: Momentum of 102 = 2% positive momentum (no conversion needed)
- Short lookback (k=10): Captures recent momentum relevant for current swing trade
- Faster signals: EMA smoothing detects acceleration/deceleration earlier
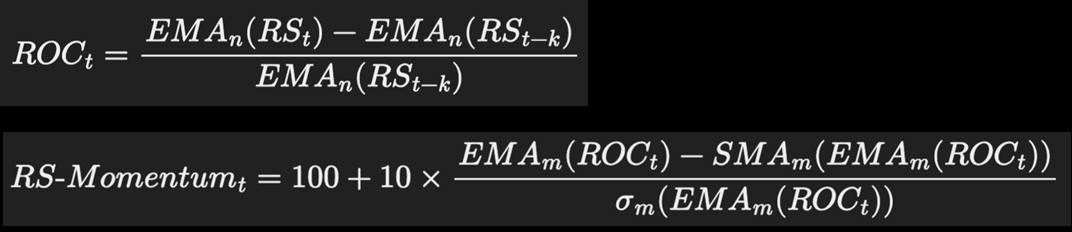
Formulas in Text:
ROC(t) = (JdKRS(t) - JdKRS(t-k)) / JdK_RS(t-k)         where k = 10 (default, ROC lookback period)
JdKROC(t) = α × ROC(t) + (1-α) × JdKROC(t-1)             where α = 2/(m+1), m = 14
RSMomentum = 100 + 10 × (JdKROC - RollingMean(JdKROC, m)) / RollingStdDev(JdKROC, m)
Note: Standard JdK calculates momentum from the smoothed RS (JdKRS) rather than RSRatio, then applies z-score normalization for statistical bounds.
Why These Enhancements Matter
| Feature | Enhanced | Standard JdK | Trading Impact | |---------|----------|--------------|----------------| | Signal Speed | 2-3 periods faster | Delayed | Earlier entry/exit | | Interpretation | Direct percentage | Statistical units | Faster decisions | | Momentum Period | 10 periods (relevant) | 52 weeks (outdated) | Current market focus | | Volatility Sensitivity | Stable ratio-based | Z-score volatility-dependent | Fewer false signals |
Installation & Setup
Prerequisites
- Python 3.8+
- AngelOne SmartAPI account with API credentials
- Internet connection for real-time data
Step-by-Step Installation
# 1. Clone or navigate to project directory
cd RRG-Chart-Visualization
2. Create virtual environment (recommended)
python -m venv venv
3. Activate virtual environment
Windows:
venv\Scripts\activate
Linux/Mac:
source venv/bin/activate
4. Install dependencies
pip install -r requirements.txt
5. Create .env file for API credentials (optional, for security)
Copy .env.example to .env and add your credentials
Configuration
Option 1: Environment Variables (Recommended) Create a .env file in the project root:
ANGELONEAPIKEY=yourapikey ANGELONECLIENTID=yourclientid ANGELONEPASSWORD=yourpassword ANGELONETOTPSECRET=yourtotpsecretOption 2: Streamlit UI Enter credentials directly in the application sidebar (credentials are stored in session state only).
Usage Guide
Starting the Application
streamlit run app.pyThe application opens at http://localhost:8501
Step-by-Step Workflow
1. Initial Setup
- Enter AngelOne API credentials (if not using .env) - Select Benchmark: NIFTY 50 (default) or NIFTY Bank - Choose Timeframe: Weekly (recommended) or Daily2. Select Securities
- Index Tab: Analyze sectoral indices (NIFTY IT, NIFTY Bank, etc.) - Stock Tab: Analyze individual stocks or entire sectors - Individual Selection: Search and select specific stocks - Sector Selection: Use "Select Sector" dropdown to add all major stocks from a sector (e.g., IT, Banking, Finance) - Sub-Sector Selection: Select sub-sectors like "Private Banks" or "PSU Banks" to analyze specific segments - ETF Tab: Analyze ETFs (NIFTYBEES, BANKBEES, etc.) - Use search to find securities or select from dropdown3. Configure Parameters
- Computation Method: Choose between "Enhanced" (default) or "Standard JDK" - Enhanced: EMA-based ratio normalization (faster signals, intuitive interpretation) - Standard JDK: JdK methodology with EMA smoothing and z-score normalization - EMA Window Period (m): - Enhanced: Default 14 (fixed for all timeframes) - Standard JDK: Default 14 (Weekly), 20 (Daily), 6 (Monthly) - ROC Shift Period (k): - Enhanced: Default 10 (Weekly), 20 (Daily), 3 (Monthly) - Standard JDK: Default 10 (Weekly), 20 (Daily), 3 (Monthly) - Tail Count: Default 8 (Enhanced) or 4 (Standard JDK) - historical trail length4. Generate Chart
- Chart auto-generates when securities are selected - Use Time Period Slider to view historical rotations - Enable Animation to see rotational movement over time5. Interpret Results
- Identify quadrant positions (see interpretation guide below) - Analyze tail trajectories (direction indicates trend) - Use animation to observe rotation cyclesInterpreting RRG Charts
Quadrant Analysis
| Quadrant | Condition | Action | Interpretation | |----------|-----------|--------|----------------| | 🟢 Leading (Top-Right) | RS > 100, Momentum > 100 | Hold/Add | Strong outperformance with accelerating momentum | | 🟡 Weakening (Bottom-Right) | RS > 100, Momentum ≤ 100 | Take Profits | Outperforming but momentum fading - early exit signal | | 🔴 Lagging (Bottom-Left) | RS ≤ 100, Momentum ≤ 100 | Avoid/Exit | Weak performance with negative momentum | | 🔵 Improving (Top-Left) | RS ≤ 100, Momentum > 100 | Early Entry | Weak but recovering - best risk/reward opportunity |
Rotation Cycle: Improving → Leading → Weakening → Lagging → Improving
Key Visual Elements
- Tail Direction: Clockwise = normal rotation; Counter-clockwise = reversal; Straight = persistent trend
- Animation: Observe rotation speed, quadrant duration, and cyclical patterns
- Position: Distance from center (100, 100) indicates strength of relative performance
Advanced Swing Trading Strategies
Strategy 1: Momentum Rotation Play
Entry: Improving quadrant (RS: 95-100, Momentum: 101-105, upward tail) Exit: Weakening signal (Momentum < 100) Hold: 6-12 weeks | R:R: 1:2 to 1:3Strategy 2: Defensive Exit
Signal: Leading → Weakening transition (Momentum drops below 101) Action: Exit 30% on first signal, 40% more if Momentum < 99, full exit on Lagging Benefit: Protects gains, frees capital for new opportunitiesStrategy 3: Contrarian Entry
Entry: Lagging → Improving transition (Momentum crosses 100, RS: 95-100) Scaling: 25% initial, 50% when RS crosses 100, 25% on Leading entry Stop: Momentum drops below 100 | Target: 15-25% returnStrategy 4: Multi-Sector Portfolio
Allocation: 40% Leading, 30% Improving, 20% Weakening (reducing), 10% Cash Rebalance: Weekly rotation from Weakening → Improving, maintain 2-3 Leading sectors Target: 12-18% annual returns with lower drawdownsStrategy 5: Cyclical Timing
Cycle: Improving (M1-2) → Leading (M3-6) → Weakening (M7-9) → Lagging (M10-12) Execution: Pre-position before Improving phase, scale in/out with rotation Requirement: 2+ years historical data to identify sector-specific cyclesTechnical Specifications
Data Requirements
- Minimum: 200+ periods for reliable calculations
- Recommended: 300+ periods for weekly charts
- Real-time: Fetches live data from AngelOne SmartAPI
Performance Characteristics
- Signal Latency: 2-3 periods faster than standard JdK
- Calculation Speed: < 2 seconds for 20 securities
- Update Frequency: Real-time on data refresh
Supported Markets
- Primary: NSE (National Stock Exchange, India)
- Indices: NIFTY 50, NIFTY Bank, Sectoral Indices
- Stocks: All NSE-listed equities
- ETFs: NIFTYBEES, BANKBEES, GOLDBEES, etc.
Project Structure
RRG-Chart-Visualization/
├── app.py                          # Main Streamlit application
├── requirements.txt                # Python dependencies
├── .env                           # API credentials (create from .env.example)
├── README.md                      # This file
├── RRGIMPLEMENTATIONCOMPARISON.md  # Detailed formula comparison
│
└── src/
    ├── rrg_calculator.py          # Enhanced RRG calculation engine
    ├── sectors.py                 # Sector and stock definitions
    ├── token_fetcher.py           # Symbol-to-token mapping
    ├── scripmastersearch.py     # Security search functionality
    │
    └── loaders/
        └── AngelOneLoader.py      # Real-time data fetcher
Key Features
- ✅ Dual Computation Methods: Enhanced (EMA-based) and Standard JDK (JdK methodology)
- ✅ Enhanced EMA-based formulas for faster signal detection
- ✅ Real-time data from AngelOne SmartAPI
- ✅ Interactive charts with Plotly (zoom, pan, hover)
- ✅ Animation mode to visualize rotation cycles
- ✅ Multi-timeframe analysis (daily, weekly, monthly)
- ✅ Customizable parameters (EMA span, ROC period, tail count)
- ✅ Index, Stock, and ETF analysis
- ✅ Sector-based selection: Quickly add all major stocks from a sector or sub-sector
- ✅ Time period slider for historical analysis
Limitations & Considerations
- API Dependency: Requires active AngelOne SmartAPI connection
- Data Quality: Calculations depend on clean, complete historical data
- Market Hours: Real-time data available only during market hours
- Lookback Period: Short-term momentum (k=10) may miss longer cycles
- Volatility: Extreme market conditions may produce temporary anomalies
Contributing & Extending
Adding Custom Strategies
The modular architecture allows easy extension:
# Example: Custom strategy function
def momentumcrossoverstrategy(rrg_data):
    leadingsectors = [s for s in rrgdata
                      if s.rs_ratio > 100 and s.momentum > 102]
    improvingsectors = [s for s in rrgdata
                        if s.rs_ratio < 100 and s.momentum > 101]
    return {
        'buy': improving_sectors,
        'hold': leading_sectors,
        'sell': [s for s in rrg_data if s.momentum < 99]
    }
Integrating with Trading Systems
- API Integration: Export RRG signals to trading platforms
- Alert System: Set up notifications for quadrant transitions
- Backtesting: Use historical RRG data to test strategies
- Portfolio Optimization: Combine RRG signals with risk models
References & Further Reading
- RRG Methodology: Julius de Kempenaer's Relative Rotation Graphs
- Sector Rotation Theory: Market cycle analysis and sector rotation patterns
- EMA vs SMA: Exponential vs Simple Moving Averages in technical analysis
- Momentum Investing: Using relative strength for portfolio construction
License
This project is for educational and personal use. Ensure compliance with AngelOne API terms of service.
Acknowledgments
- Data integration with AngelOne SmartAPI
- Visualization framework inspired by https://github.com/An0n1mity/RRGPy
Built for investors and swing traders who understand that markets rotate, not just move. Identify the rotation before it becomes obvious.


