
In this project, a RFM model is implemented to relate to customers in each segment. Assessed the Data Quality, performed EDA using Python and created Dashboard using Tableau.
Last updated Jun 30, 2026
95
Stars
27
Forks
0
Issues
+2
Stars/day
Attention Score
14
Topics
Language breakdown
No language data available.
▸ Files
click to expand
README
Data Analytics Customer Segmentation
Goal of the project
The purpose of this project is to conduct a Customer Segmentation Analysis for an Automobile bike Company. Customer segmentation is performed by developing a RFM Model. RFM (Recency, Frequency, Monetary) analysis is a behavior-based approach grouping customers into segments. It groups the customers on the basis of their previous purchase transactions. In this analysis the customer segment was divided into 11 groups. The analysis will help in determining which customers segments should be targeted in order to enhance sales revenue for the company. A Sales Dashboard for Customer Segmentation is developed using Tableau and the data quality assessment and analysis is done using Python.Tableau Dashboard
The Sales Dashboard for Customer Segmentation can be found here.
In case of failure of loading Jupyter Notebooks on Github, the following notebooks can be found in nbviewer. Click on the respective hyperlinks to view:
- RFM Analysis.ipynb
- DQA and Data Cleaning CustomerDemographic.ipynb
- DQA and Data Cleaning NewCustomerList.ipynb
- DQA and Data Cleaning Transactions.ipynb
- DQA and Data Cleaning Customer Address.ipynb
Analysis Approach
1. Data Quality Assessment and Data Cleaning
The first step towards generating useful insights from the data was the data prepartion, quality assessment and data cleaning step. After the cleaning process exploratory data analysis on the dataset and identification customer purchasing behaviours to generate insights can be performed.In the data cleaning step the data quality of the following datasets were first assesed. After a data quality assessment the following data quality issues was observed and the necessary process to mitigate the issue was followed :
- CustomerDemographics.xlsx :
- NewCustomerList.xlsx :
- Transaction_data.xlsx :
- CustomerAddress.xlsx :
2. Exploratory Data Analysis on Customer Segments
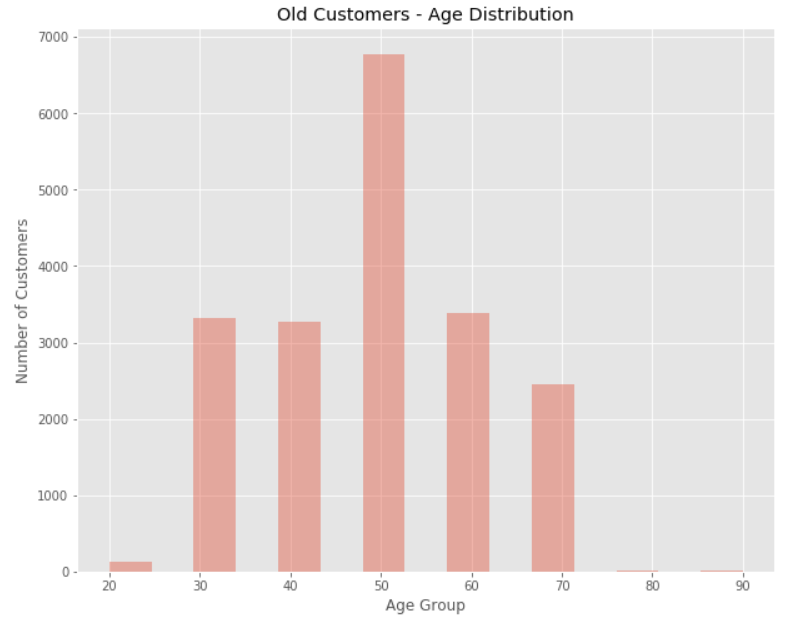
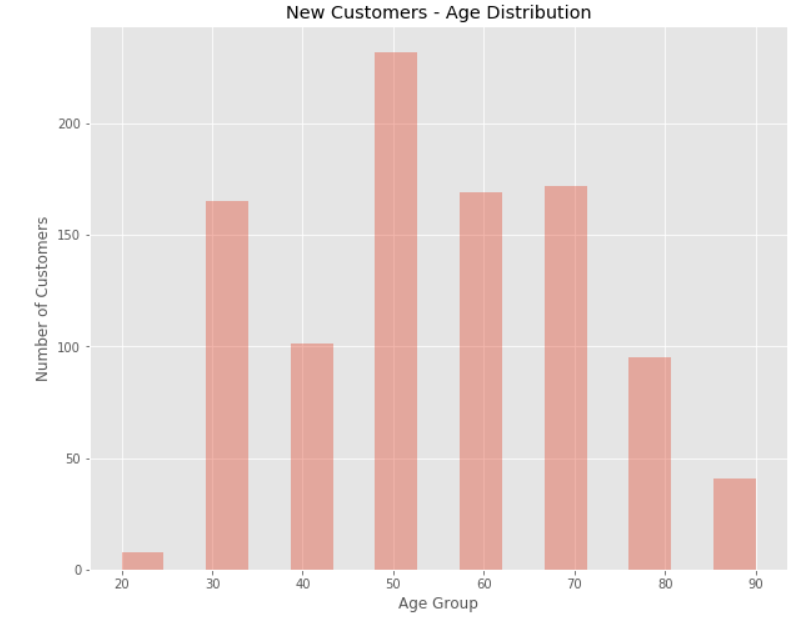
After the data cleaning process, exploratory analysis on the dataset is performed and the following insights are obtained :- New vs Old Customers Age Distribution
| Old Customers by Age Distribution | New Customers by Age Distribution |
 |
 |
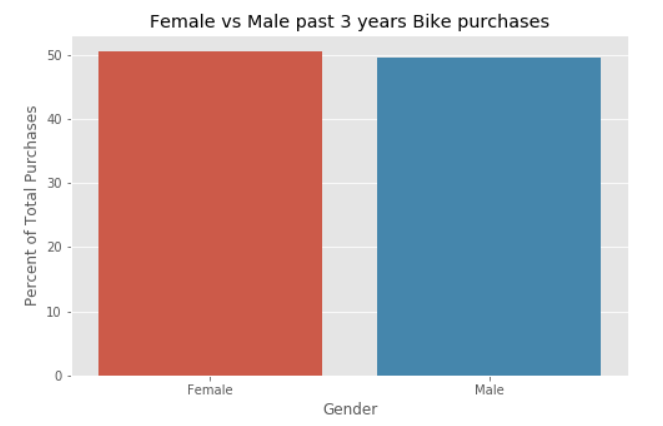
- Bike purchases over last 3 years by Gender
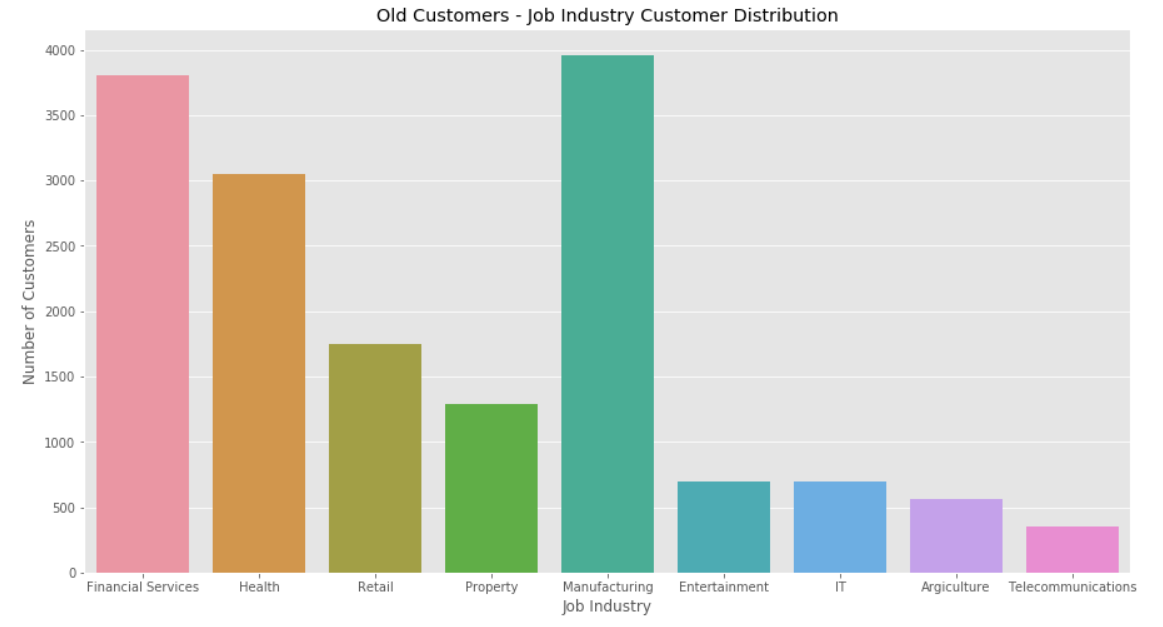
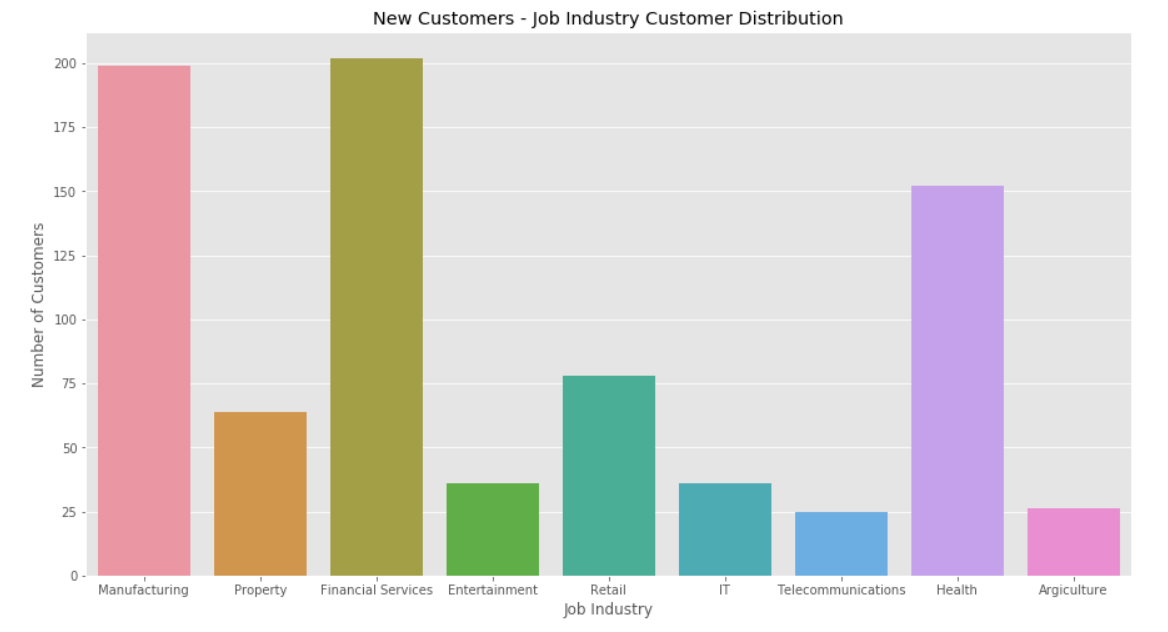
- New vs Old Customers Job Industry Distribution
| Old Customers by Job Industry | New Customers by Job Industry |
 |
 |
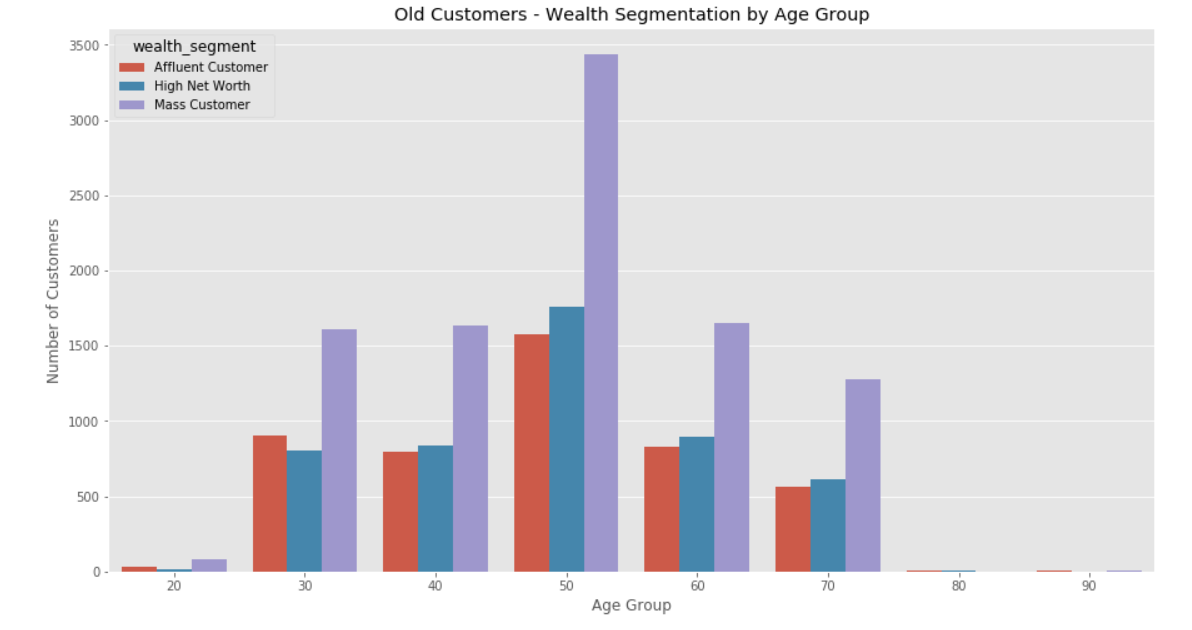
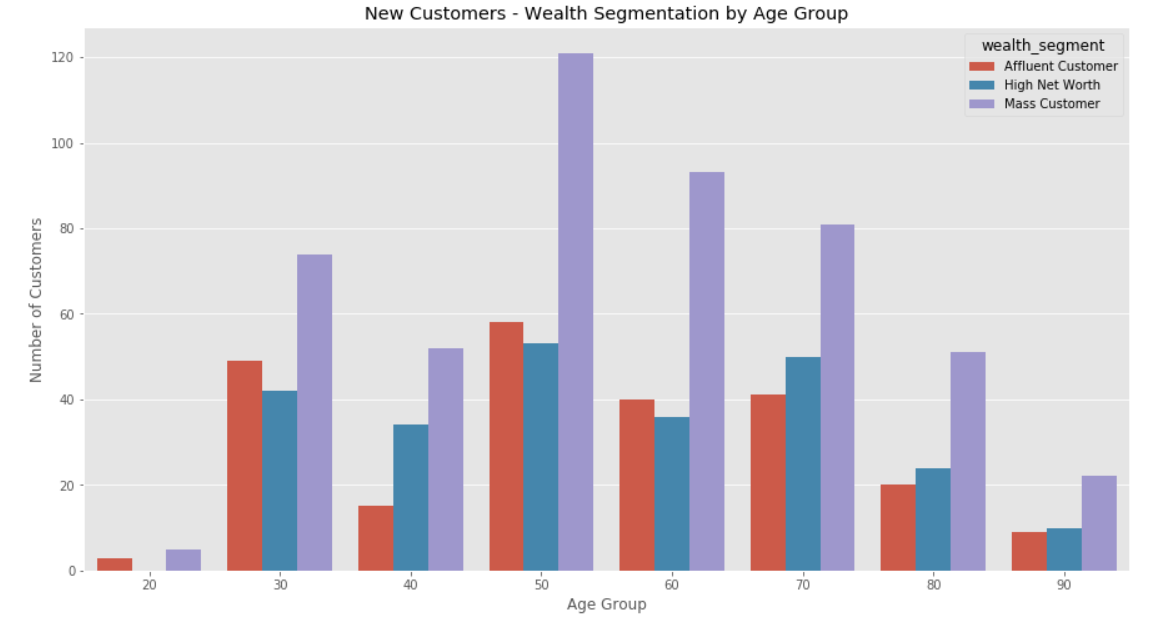
- Wealth Segmentation by Age Category
| Old Customers Wealth by Age Group | New Customers Wealth by Age Group |
 |
 |
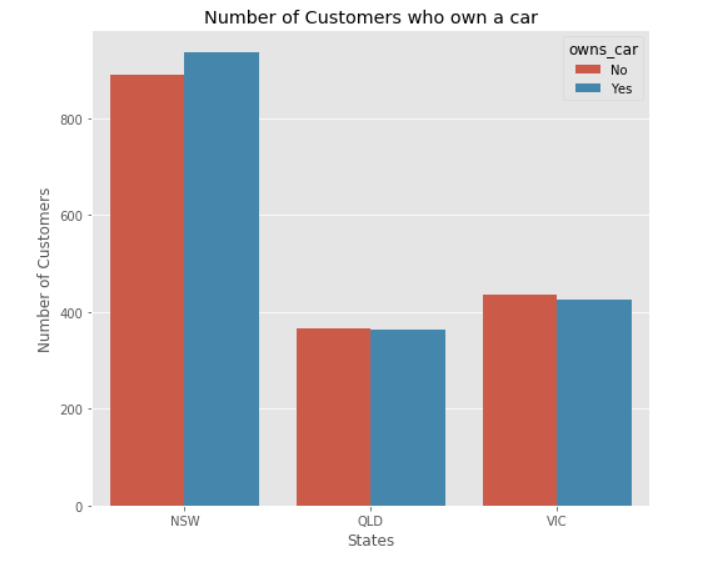
- Cars owned by States
3. RFM Analysis and Customer Segmentation
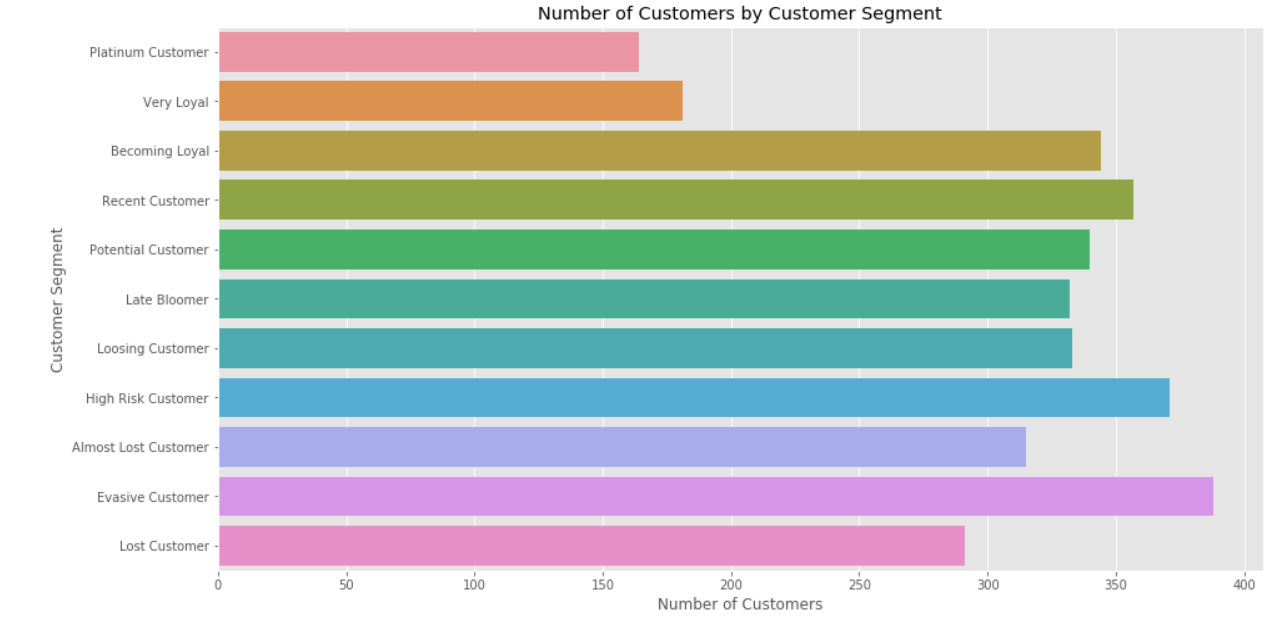
In this stage of analysis the customer segmentation was done by developing an RFM Model. The RFM (Recency, Frequency, Monetary) analysis is a behavior-based approach grouping customers into segments. It groups the customers on the basis of their previous purchase transactions.In this analysis the customer segment was divided into 11 groups. The groups being :
- Platinum Customers
- Very Loyal Customers
- Recent Customers
- Potential Customers
- Lost Customers
- Losing Customers
- Late Bloomer
- High Risk Customers
- Evasive Customers
- Becoming Loyal
- Almost lost Customers
4. RFM Analysis: Scatter Plots
Recency vs Monetary :
The visualization shows that recent customers have purchased more products and generated relatively more revenue than the customers who visited a while ageo.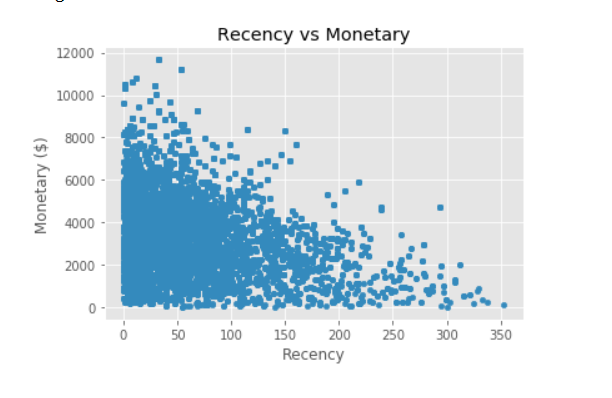
Frequency vs Monetary :
The visualization shows that customers belonging to Platinum/ Very Loyal/ Becoming Loyal Customer Segments have a greater frequency and generate greater monetary for the business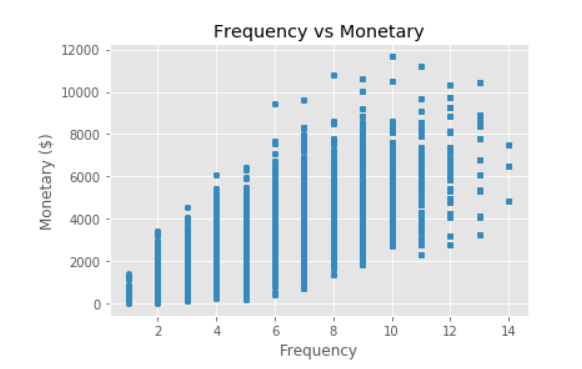
Datasets Used
The datasets used include:- Raw_data.xlsx: This excel file dataset included the following sheets of data:
Tools and Technologies used
The tools used in this project include:- Python - This was needed to conduct Data Quality Assessment and also for Data Cleaning processes. With Python libraries pandas, matplotlib, seaborn exploratory data analysis of the datasets and to gain useful insights from the data was possible.
- Tableau - This Business Intelligence tool was required to explore data and create charts, graphs, visualizations to come up with a Sales Dashboard for Customer Segmenatation for the automobile bike company. The Tableau Sales Dashboard can be found here
Built With
- Python 3.8.2, Tableau
Authors
- Abhishek Chowdhury - Github Profile


